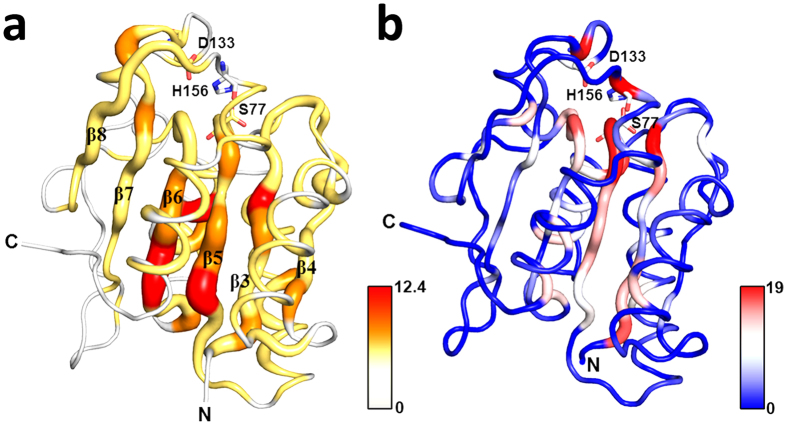
Figure 1.
Comparison of evolutionary-coupling analyses (a) and site-saturation scanning mutagenesis data (b) mapped onto the X-ray structure of BsLA. Evolutionary coupled residues were inferred from a multiple sequence alignment using the EVcoupling webserver (www.evfold.org). The obtained evolutionary constraints (EC) values were mapped onto the X-ray structure of BsLA (PDB Entry: 1I6W)30. The magnitude of the obtained EC scores is color-coded (low values in yellow; high values in red). Additionally, EC values are encoded by sausage thickness representing the magnitude of the EC score. For orientation, the central β-scaffold (β3- β8) of BsLA is labelled according to topological order30. The number of inactive BsLA variants per residue was obtained from a complete site-saturation mutagenesis dataset (b) and mapped onto the BsLA X-ray structure. The number of inactive variants is encoded by color (blue: low values; red: high values) and sausage thickness. The N- and C-termini of BsLA are indicated. The residues of the catalytic triad, Ser77, Asp133 and His156 are shown as sticks with oxygen in red, carbon in grey and nitrogen atoms in blue. The color-bars next to the respective figure represent the plotted scale of EC values and the number of inactive BsLA variants per mutated site.

