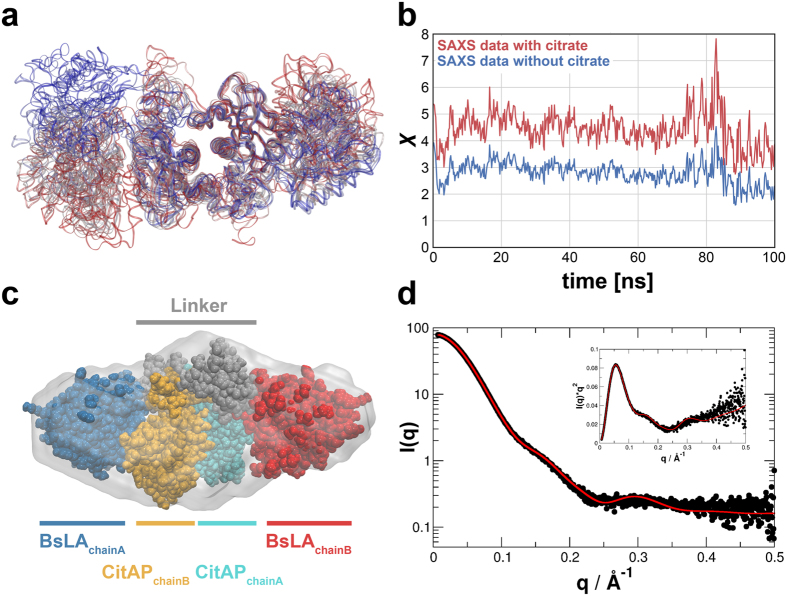
Figure 5.
(a) Structural changes during the molecular dynamics (MD) simulations of the dimeric Mlow-free CitAP-BsLA model. The proteins are shown as ribbons and the colors represent structures at different times, changing from red at t = 0 ns to blue at t = 100 ns. (b) Time evolution of χ during the MD simulations of the Mlow-free model. Deviation between the model and experimental data measured at 5 mg/ml (blue) and without citrate (red) are shown. (c) Final model of the CitAP-BsLA dimer complex superimposed onto the SAXS derived low-resolution envelope obtained from SAXS data at high protein concentration in the presence of citrate. (d) SAXS scattering curve recorded for CitAP-BsLA at a protein concentration of 5 mg/ml in the presence of citrate (black dots) and the CRYSOL-fitted theoretical scattering curve of the final CitAP-BsLA dimer model (red line).

