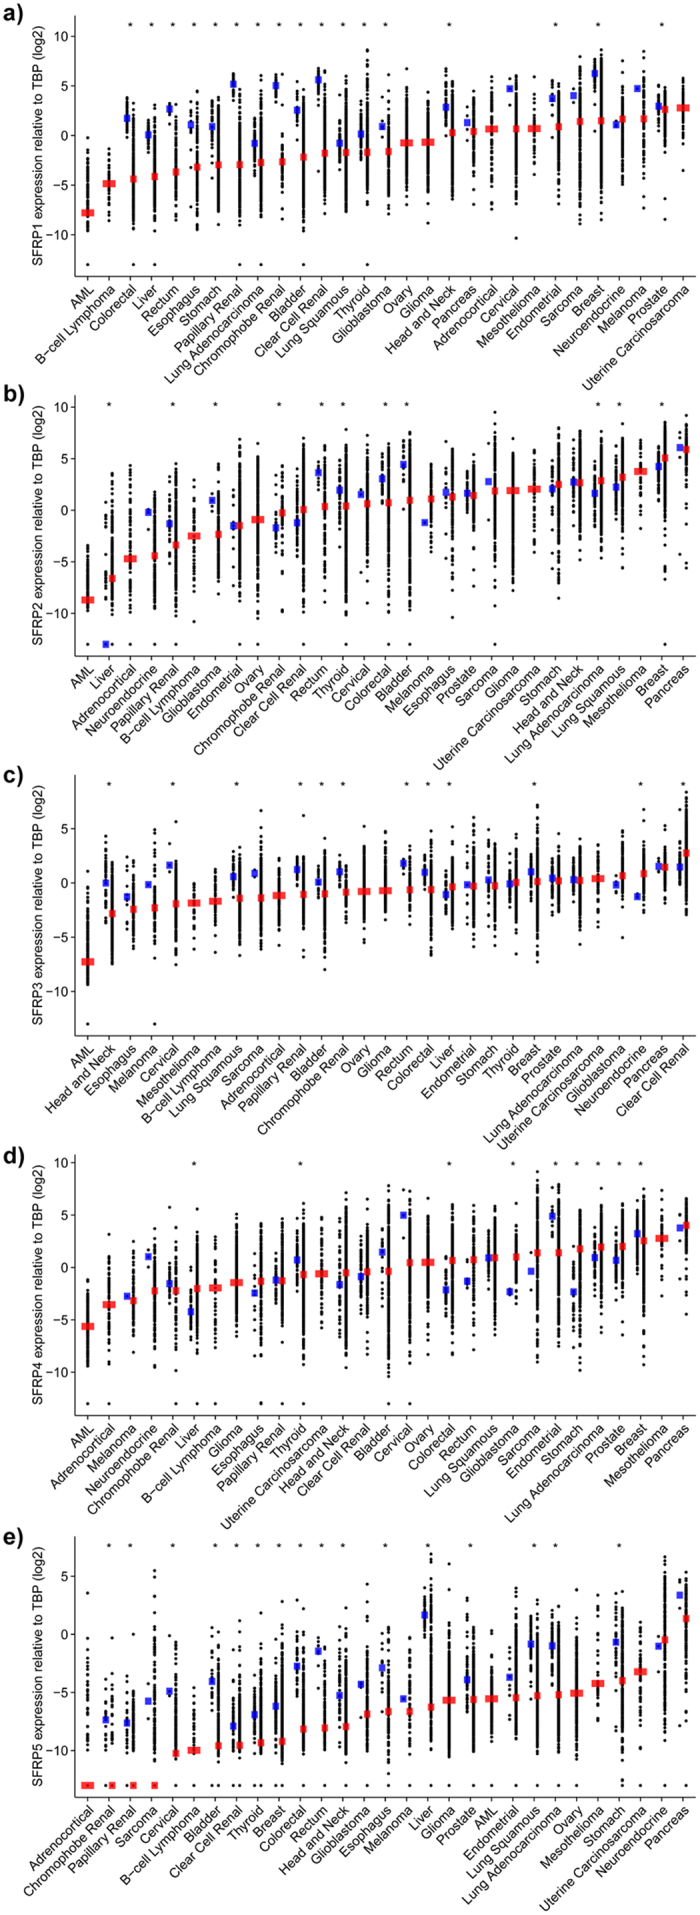
Figure 2. Expression levels of SFRPs in normal and cancerous tissue types.

Expression levels of (a) SFRP1, (b) SFRP2, (c) SFRP3, (d) SFRP4, and (e) SFRP5 in patient samples. Each data point represents the SFRP expression levels (log2[RSEM normalized values relative to TBP]) of one tumour or normal sample. Horizontal bars indicate median expression values for normal (blue) or primary tumour (red) samples. Zero value SFRP expressors are plotted at the bottom of the y axis. Comparisons between the normal and tumour expression values were performed using the Mann-Whitney U test to determine significance (*p < 0.05).
