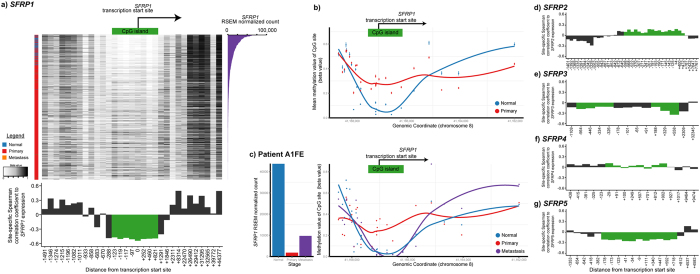
Figure 3. SFRP1 promoter methylation correlates to SFRP1 gene expression in breast cancer.
(a) Heatmap depiction of SFRP1 methylation levels of individual CpG sites (beta values: black, methylated; white, unmethylated) in breast tumour samples ordered from high SFRP1 expression levels (top) to low SFRP1 expression levels (bottom). Left bar indicates sample source: blue, normal samples; red, primary sample; orange, metastatic sample. Right barplot depicts SFRP1 expression levels (RSEM normalized values). Bottom barplot depicts Spearman’s correlation coefficients for site-specific methylation levels (beta values) to SFRP1 RSEM normalized values. (b) Scatterplot depicting average CpG methylation values +/− SEM of the SFRP1 genomic locus of normal (blue) and primary (red) breast cancer tumour samples. Curves represent loess smoothed data. (c) Barplot of SFRP1 expression levels (RSEM normalized values) in normal, primary tumour and metastatic tumour samples from the same patient. Scatterplot of CpG methylation values of the SFRP1 genomic locus in normal, primary and metastatic tumour samples from the same patient. Barplot of Spearman’s correlation coefficients for site-specific methylation beta levels to (d) SFRP2, (e) SFRP3, (f) SFRP4, and (g) SFRP5 RSEM normalized values.

