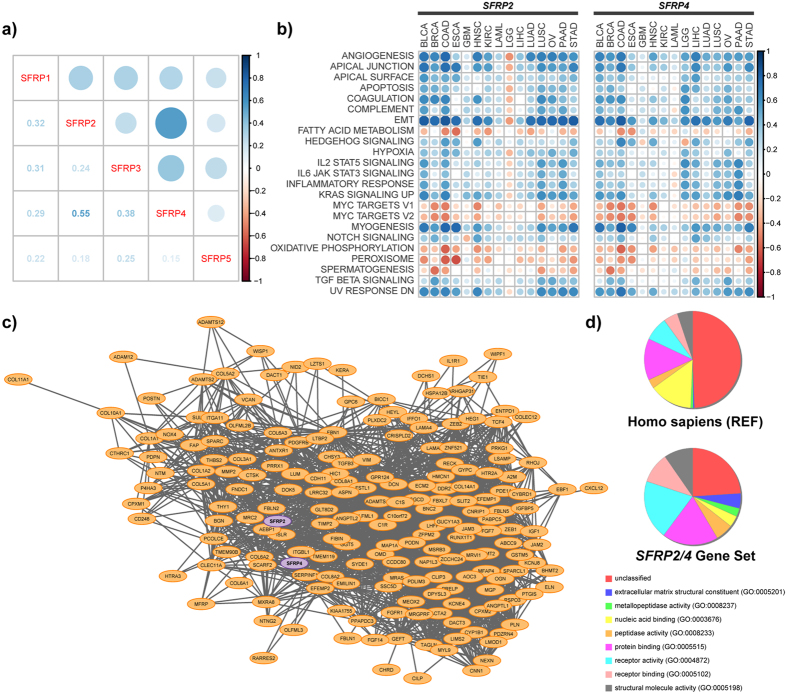
Figure 5. SFRP2 and SFRP4 expression strongly associates with an EMT signature.
(a) Correlation matrix of the expression levels of different SFRP family members (log2[RSEM normalized values + 1]) in primary tumours. Average of Pearson’s correlation coefficient of gene-gene pairs from 15 different cancers. (b) Correlation matrix of SFRP2 and SFRP4 expression values (log2[RSEM normalized values + 1]) with individual gene sets (GAGE determined enrichment values for MSigDb Hallmark gene sets) in 15 different cancers. Gene sets were included if they had an absolute correlation coefficient of over 0.5 with SFRP2 or 4 expression values. (c) Correlation network analysis of SFRP2 and 4 reveals a common gene set. The network displayed genes whose expression strongly correlates (r > 0.5) with SFRP2 and 4 in over 50% of cancers where they are a poor prognostic factor. Nodes colours indicate SFRP member location (purple, SFRPs; orange, others); edges represent average correlation coefficient >0.8 in the STAD dataset. (d) SFRP2 and 4 correlated genes (n = 180) were classified using PANTHER Classification System based on molecular function.

