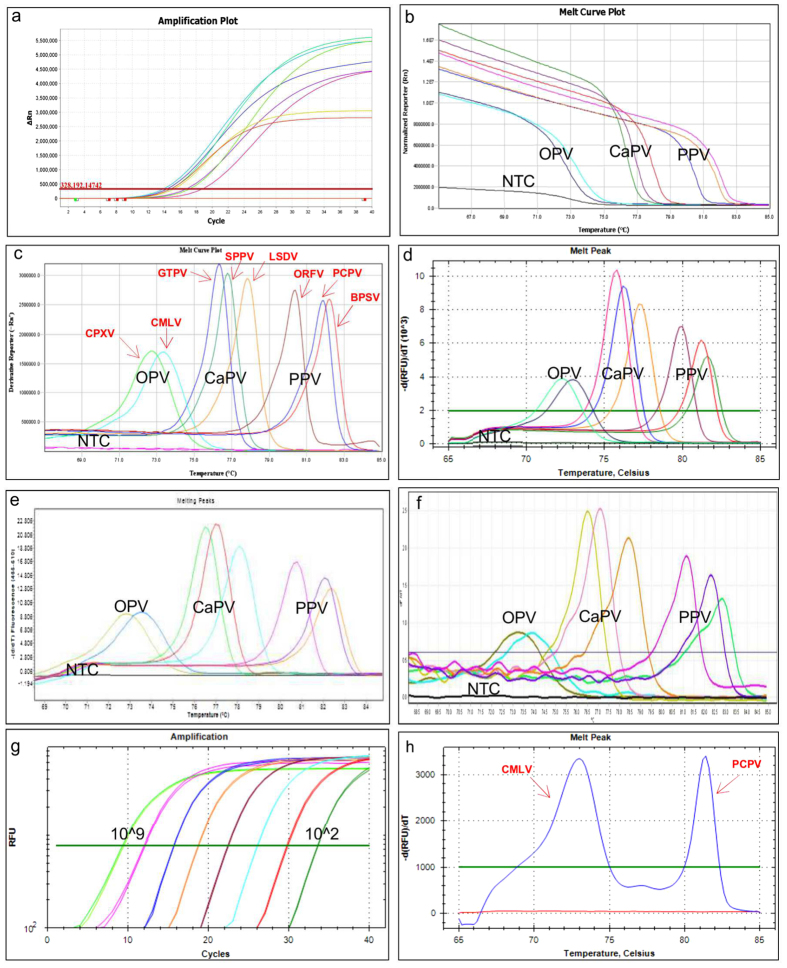
Figure 2. Melting curve analysis of the targeted eight poxviruses using different PCR platforms.
Each genotype displayed a unique melting peak. (a). amplification plot; (b). melt curve plot; (c). melting peaks using the QuantStudio 6, Life Technologies); (d). melting peaks using the CFX96, Bio-Rad; (e). melting peaks using LC480II, Roche; (f). melting peaks using the Rotor Gene Q, Qiagen); (g). Linearity test (109 to 102 virus copies); and (h). Co-infection with CMLV and camel PCPV (blue colour two melting peaks, 72.80 °C and 81.20 °C for CMLV and camel PCPV respectively).

