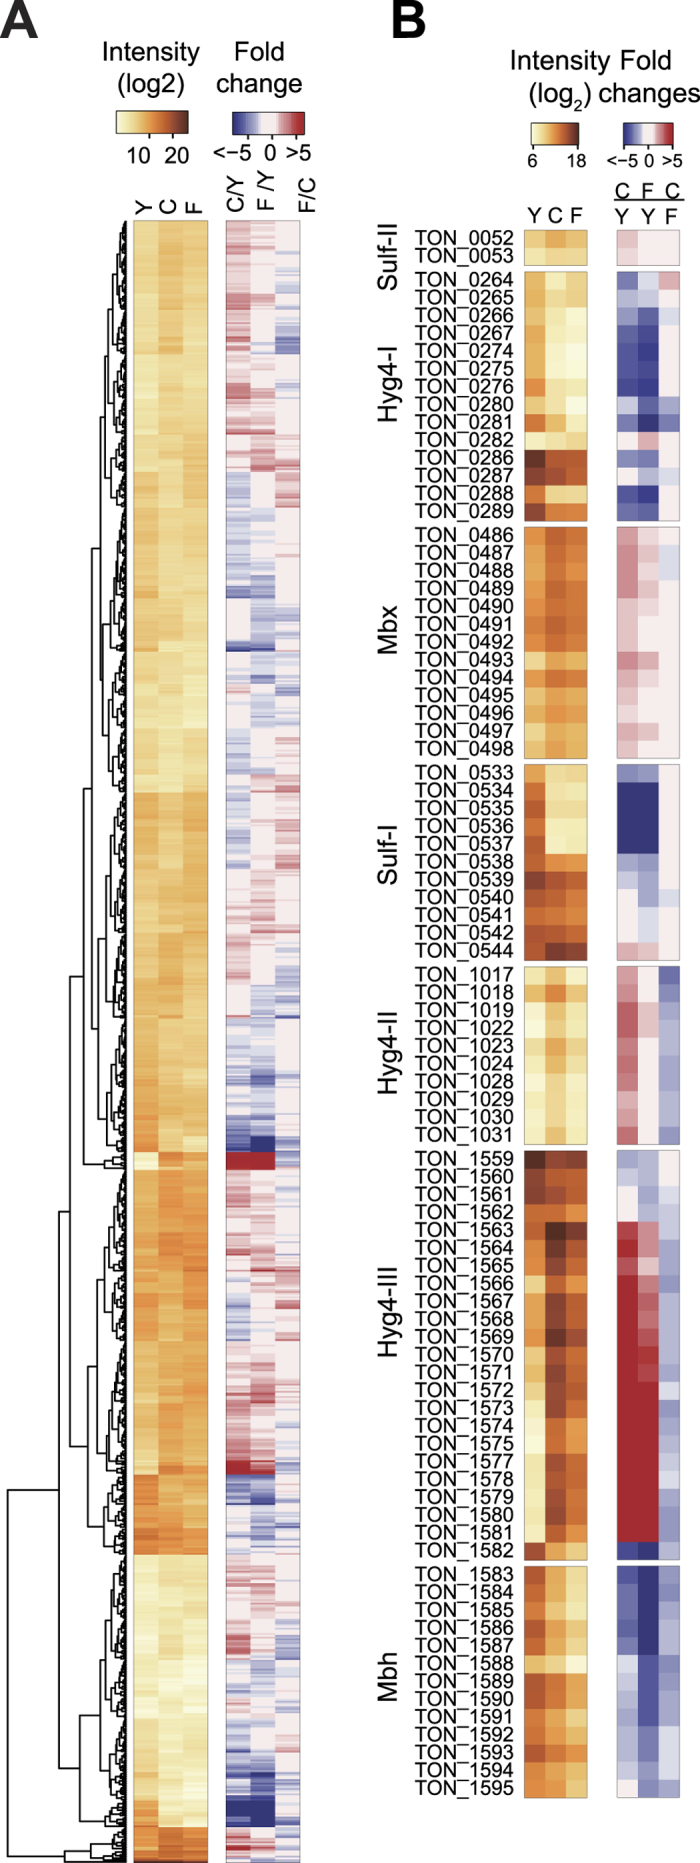
Figure 4. Dynamic RNA expression changes according to the gene function.

(A) Normalized RNA expression and differential expression according to the culture media; YPS (“Y”), MMC (“C”), and MMF (“F”) as shown using a heat map. (B) The RNA expression and regulation of hydrogenase-related genes were shown in three hydrogenase clusters (Hyg4), sulfhydrogenase (Sulf), membrane-bound oxidoreductase (Mbx-I), and membrane bound hydrogenase (Mbh) clusters using a heat map.
