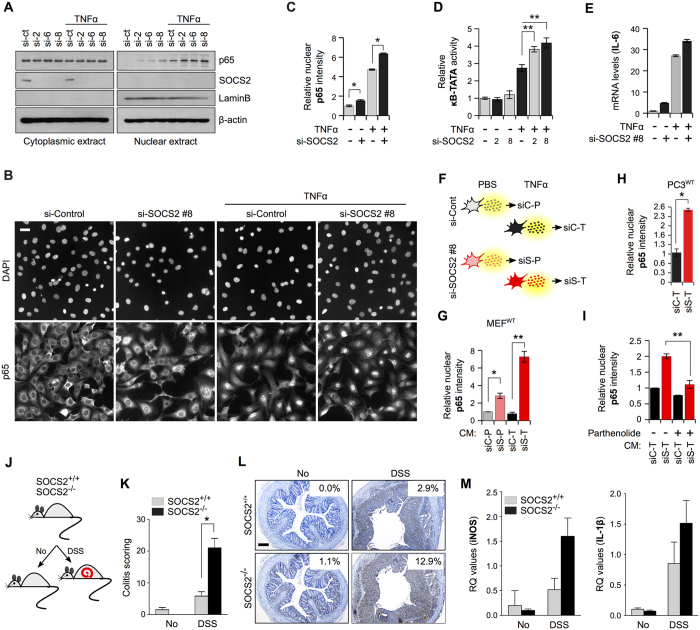
Figure 4. SOCS2 inhibits TNFα-induced NF-κB signaling.
(A) MEFs were transfected with either NT or 3 different SOCS2 siRNAs. After 36 hours cells were treated with TNFα (10 ng/ml) for 45 mins and cytoplasmic and nuclear fractions were probed with the indicated antibodies. (B) MEFs were transfected with NT or SOCS2 siRNA as shown. After 36 hrs cells were treated with TNFα (10 ng/ml) for 45 mins or left untreated before being processed for immunofluorescence microscopy against p65 using HCQI. Scale bar represents 100 μm. (C) Automated unbiased quantitation of nuclear p65 staining intensity was done using the ScanR software. Mean fluorescence intensity of p65 per nucleus for each ‘plate’ were determined. Data is representative of two independent experiments and depicts relative fold change ± standard error. (D) MEFs grown in 60 mm dishes were transfected with NT or SOCS2 siRNA along with pGL4.10-NF-κB (100 ng) and pGL4.74-(hRluc/TK (10 ng) as shown. After 36 hrs cells were either treated with TNFα (10 ng/ml for 6 hrs) or left untreated. Bar graph represents normalized luciferase readings against Renilla reporter activity for three independent experiments. (E) Q–PCR analysis of NF-κB target gene IL-6 was performed using total RNAs extracted from MEFs transfected with NT or SOCS2 siRNAs and treated with TNFα (10 ng/ml for 1 hour). 18S rRNA was used as internal control. (F) Schematics of the treatments of MEFs for preparing conditioned media (CM). (G) Serum-starved MEFs were exposed to CM prepared above for 1 hour before being processed as in (B) and quantitated as in (C). (H) Serum starved (16 hrs) PC3 cells were treated as in (G) with the indicated CM and quantified as in (C). (I) Serum-starved MEFs were exposed to CM, prepared as in (F) with the exception that parthenolide was added to the cells together with TNFα as indicated, for 1 hour before being processed as in (B) and quantitated as in (C). (J) Schematics showing the DSS treatment for inducing ulcerative colitis in mice. (K) Representative images of colon tissues from SOCS2+/+ and SOCS2−/− mice exposed to DSS as indicated in (J) and probed for p65 using immunohistochemistry. (L) Histology scoring for colitis based on multiple parameters (see Methods section). White boxes on each image represent a staining index quantified by ImmunoRatio web application using default parameters47. Scale bars represent 200 μm. (M) Q–PCR analysis of the indicated genes in total RNA isolated from colonic tissues of SOCS2+/+ and SOCS2−/− mice exposed to DSS as indicated in (D). For all Figures, *P value < 0.05 and **P value < 0.005.

