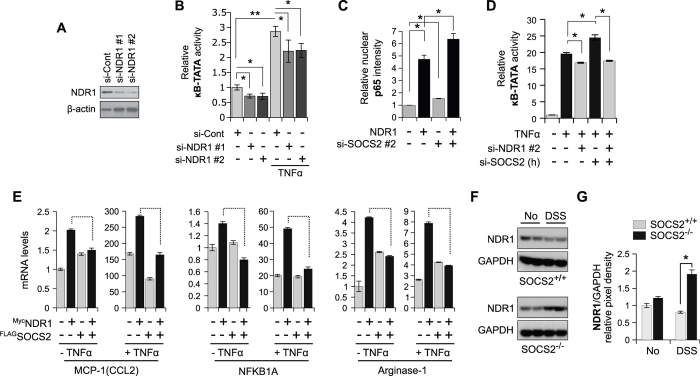
Figure 5. SOCS2 inhibits TNFα-NDR1-NF-κB axis.
(A) Efficacy testing of siRNAs in MEFs against NDR1 using IB. (B) MEFs were transfected with NT siRNA or NDR1 siRNAs. After 36 hrs cells were treated with TNFα (10 ng/ml) for 1 hour and luciferase assay was performed as in Fig. 4D. (C) MEFs were cotransfected with a plasmid for Myc-NDR1 and SOCS2 siRNA as shown. After 36 hrs cells were treated with TNFα (10 ng/ml) for 1 hour before being fixed and processed for HCQI. Nuclear p65 intensity values were quantified and plotted as in Fig. 1C. (D) HEK293T cells were transfected with NT or SOCS2 siRNA (human) as shown and luciferase assay was performed as in Fig. 4D. (E) Quantitative RT-PCR analysis of NF-κB target genes was performed using total RNAs extracted from MEFs transfected with FLAG-SOCS2 & Myc-NDR1 and treated with TNFα (10 ng/ml for 1 hour) or left untreated as shown. (F) Evaluation of endogenous protein levels of NDR1 using IB in extracts prepared from colonic tissues of SOCS2+/+ and SOCS2−/− mice, pre- and post-DSS insult as shown. (G) Pixel densitometry values of NDR1 bands obtained using ImageJ and normalized against GAPDH are shown as a bar graph. SE values are averages of densitometry readings from two representative mice. For all Figures, *P value < 0.05 and **P value < 0.005.

