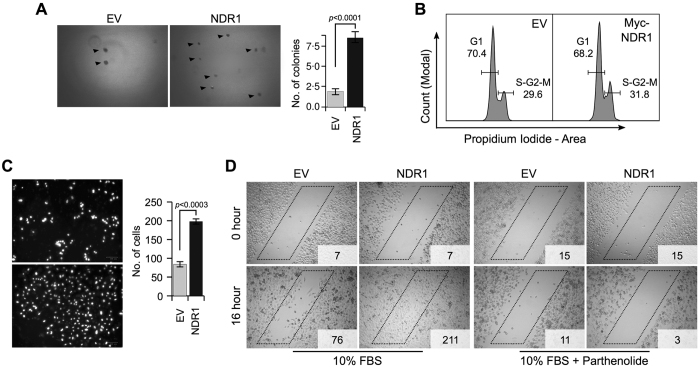
Figure 6. NDR1 acts as an oncogene in PC3 cells.
(A) Representative images of soft-agar colony formation assay in PC3 cells transfected with EV or NDR1 plasmid. Bar graph displays data from three independent experiments and represents mean ± standard error. (B) Cell cycle profile from FACS analysis of cells transfected as in (A). (C) Representative images of matrigel invasion assay of PC3 cells transfected as in (A). Bar graph displays data from three independent experiments and represents mean ± standard error. (D) Representative images of “wound-healing” assay in PC3 cells transfected as in (A) and treated with NF-κB inhibitor parthenolide as shown. Numbers in insets represents cell count within the “box”.

