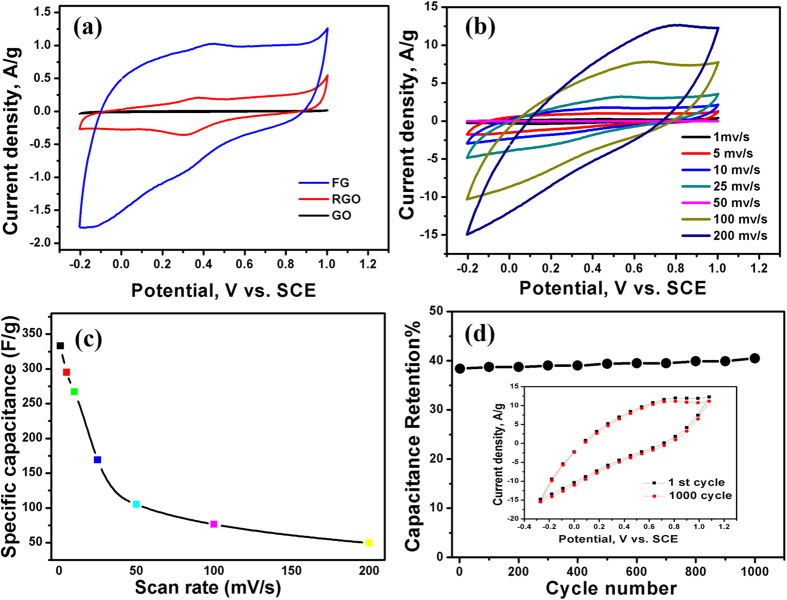
Figure 7.
(a) Cyclic voltammogrames of FG, RGO and GO electrodes in 0.5 M H2SO4 at a scan rate of 5 mV/s, (b) the cyclic voltammogrames of FG electrodes at different scan rates, (c) the corresponding specific capacitance of FG electrodes at different scan rates in 0.5 M H2SO4, and (d) the first and 1000th CV cycles of the FG electrodes.

