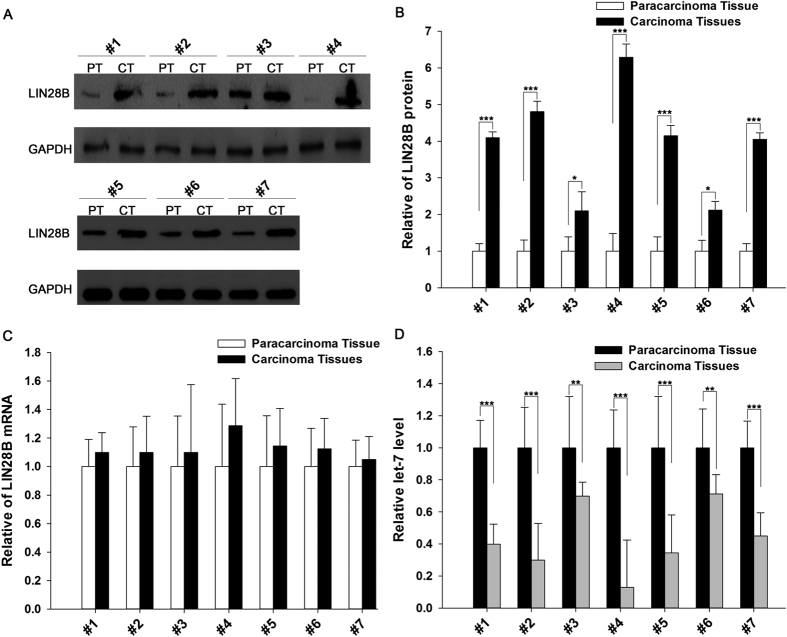
Figure 1. The LIN28B protein and mRNA and let-7 expression levels in NSCLC tissues.
(A and B) The results of a Western blot analysis of the expression levels of the LIN28B protein in 7 pairs of cancer (CT) and normal adjacent (PT) tissue samples. (A) A representative image; (B) The results of a quantitative analysis. Full-length blots/gels are presented in Supplementary Fig. 6. (C) The results of a quantitative RT-PCR analysis of the relative expression levels of LIN28B mRNA in 7 pairs of CT and PT samples. (D) The results of a quantitative RT-PCR analysis of the relative expression levels of let-7 in 7 pairs of CT and PT samples. The results are presented as the means ± SE of three independent experiments (*P < 0.05, **P < 0.01, ***P < 0.001).

