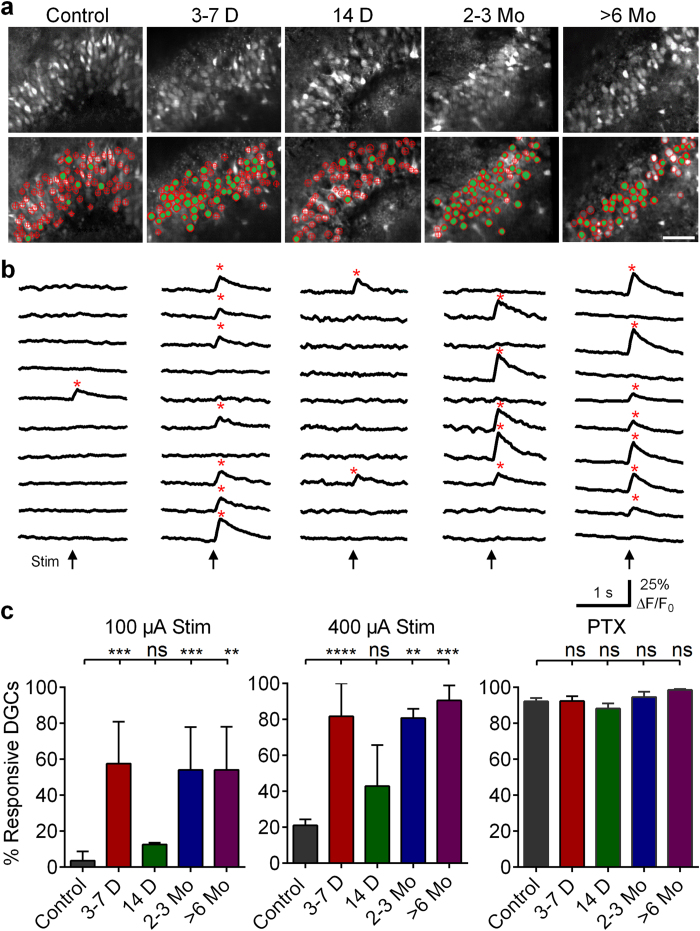
Figure 1. Changes in DGC activation during epileptogenesis.
(a) Confocal micrographs of OGB-1-loaded DGCs from control mice and at defined time-points post-SE. Below are same images with overlaid ROIs depicting non-activating (hollow red ROIs) and activating DGCs (red ROIs filled green) in response to 100 μA PP stimulation. Scale bars: 50 μm. (b) Representative traces of time-resolved calcium imaging responses from representative ROIs selected from images above. Arrows below traces indicate the time of stimulation. * (red) denote cellular activation detected with Ca2+ transient detection software. (c) Plots of the proportional DGC activation (%) to 100 μA (left) and 400 μA (middle) PP stimulation, as well as 400 μA stimulation in the presence of 50 μM PTX (right). Note the significantly augmented DGC activation at 3–7 days, 2–3 months and >6 months post-SE compared to Controls. Samples sizes as (n [slices], replicates [mice], total number cells [ROIs]): Control: (23,9,1020); 3–7 Days: (9,6,517); 14 days: (7,3,405); 2–3 Months: (8,3,443); 6 Months: (6,3,372). Kruskal-Wallis test with Dunn’s multiple-comparison post hoc testing, left and center are log(value + 1) transformed to equalize variance before statistical testing, 100 μA: H(4,48) = 32.74; 400 μA: H(4,48) = 35.49, PTX H(4,48) = 6.418. Levels of significance indicated as: ns p > 0.05, *p < 0.05, **p < 0.01, ***p < 0.001, ****p < 0.0001. Histograms indicate median ± interquartile range. Also, see Supplementary Videos S1,S2,S3,S4,S5 for visualization of differences between DGC activation at each defined time point.

