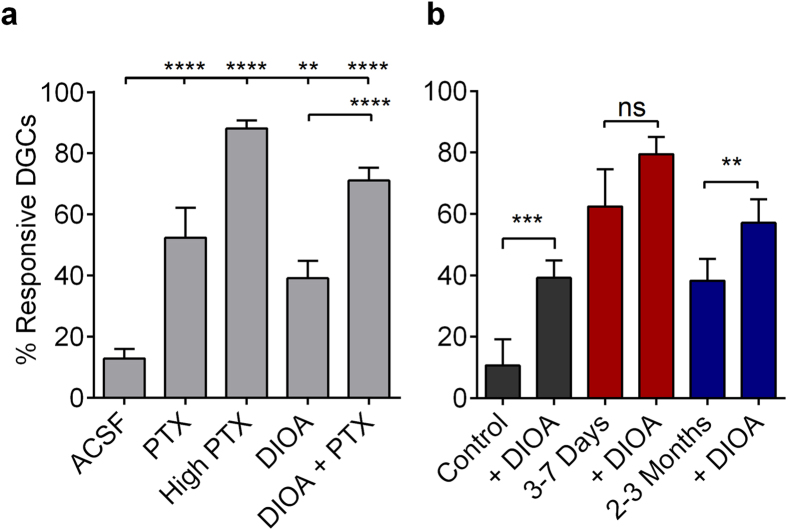
Figure 6. Disruption in inhibitory function degrades sparse DGC activation.
(a) Plot of the proportional DGC activation (%) in control slices following 400 μA PP stimulation in control ACSF, 20 μM DIOA, 5 μM PTX, 20 μM DIOA + 5 μM PTX, and 50 μM PTX. Samples sizes are as follows as (n [slices], total number of cells [ROIs]), Control ACSF: (15,565); 5 μM PTX: (6, 239); 50 μM PTX: (15,565); 20 μM DIOA: (9,326); 20 μM DIOA + 5 μM PTX: (15, 565); Slices prepared from 4 naïve mice. Significance tested with one-way ANOVA, F(4.55) = 54.25, p < 0.0001, with Tukey’s multiple-comparison post hoc testing. (b) Plots of DIOA (20 μM) effects on the proportional DGC activation (%) to 400 μA PP stimulation in slices prepared from control, 3–7 days post-SE, and 2–3 months post-SE mice. Note the occlusion of DIOA effects at the 3–7 days post-SE time point. Samples sizes as (n [slices], replicates [mice], total number of cells [ROIs]), Control: (9,3,367); 3–7 days post-SE: (8,4,348); 2–3 months post-SE: (8,3,355). Significance tested with two-tailed, paired t-tests, Control: t(8) = 6.025; 3–7 days: t(7) = 1.524; and 2–3 months: t(7) = 3.956. (a,b) Histograms indicate means ± S.E.M. Levels of significance: ns p > 0.05, **p < 0.01, ***p < 0.001, ****p < 0.0001.

