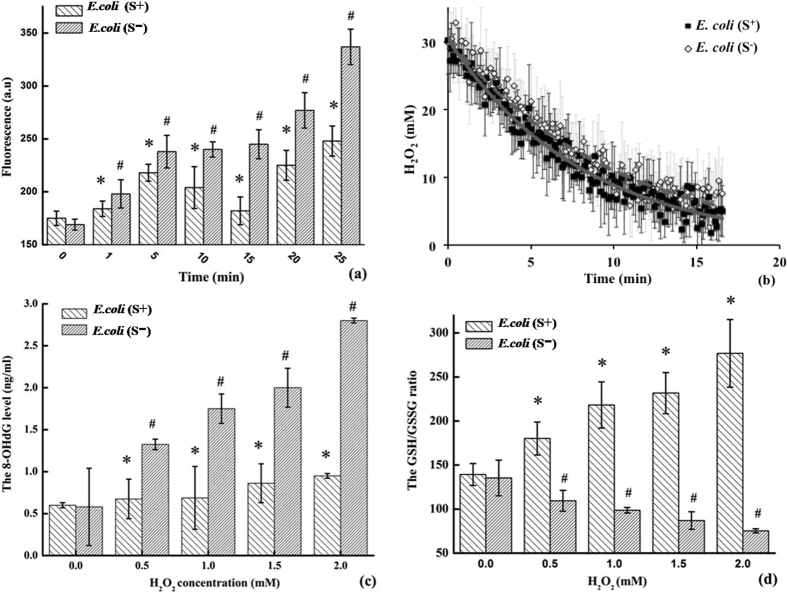
Figure 1. The in vivo antioxidant response.
(a) The intracellular ROS levels measured by the DCF fluorescent intensity at excitation of 485 nm and emission of 528 nm, treated with 0.5 mM H2O2; (b) the time-resolved peroxide concentrations monitored with Raman vibration at 876 cm−1 and initial concentration of 30 mM H2O2; (c) the 8-OHdG level and (d) the GSH:GSSG ratio in the samples treated for 4 hours with moderate concentrations of H2O2 (the treatments included 6.0 μM FeSO4 as Fenton’s catalyst; asterisk and octothorp mark the statistical significance, p < 0.05).

