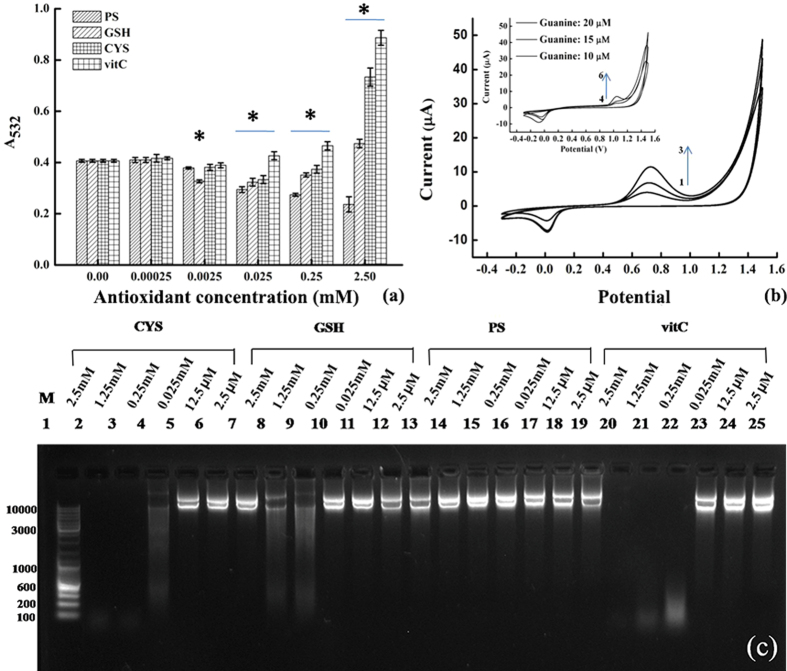
Figure 3. The antioxidant and pro-oxidant properties of phosphorothioate (PS), compared to the other antioxidants.
(a) The ROS levels characterized by the amounts of TBARS with the absorbance at wavelength of 532 nm in 30 min, generated by Fenton’s reagent of 50 μM FeSO4 and 1.0 mM H2O2 at 37 °C and quenched with gradient antioxidant concentrations from 0.25 μM to 2.5 mM; (b) the cyclic voltammograms of the phosphorothioate model compound (lines 1–3: 10, 15, and 20 μM, respectively) and 2′-deoxyguanosine (insert, lines 4–6: 10, 15, and 20 μM, respectively), with potential voltages referred to a Ag/AgCl electrode; (c) the image of gel electrophoresis, in which 50 μg/mL plasmid DNA were pre-treated with the Fe(III)-modified Fenton’s reagent and gradient concentrations of antioxidants from 2.5 mM to 2.5 μM.

