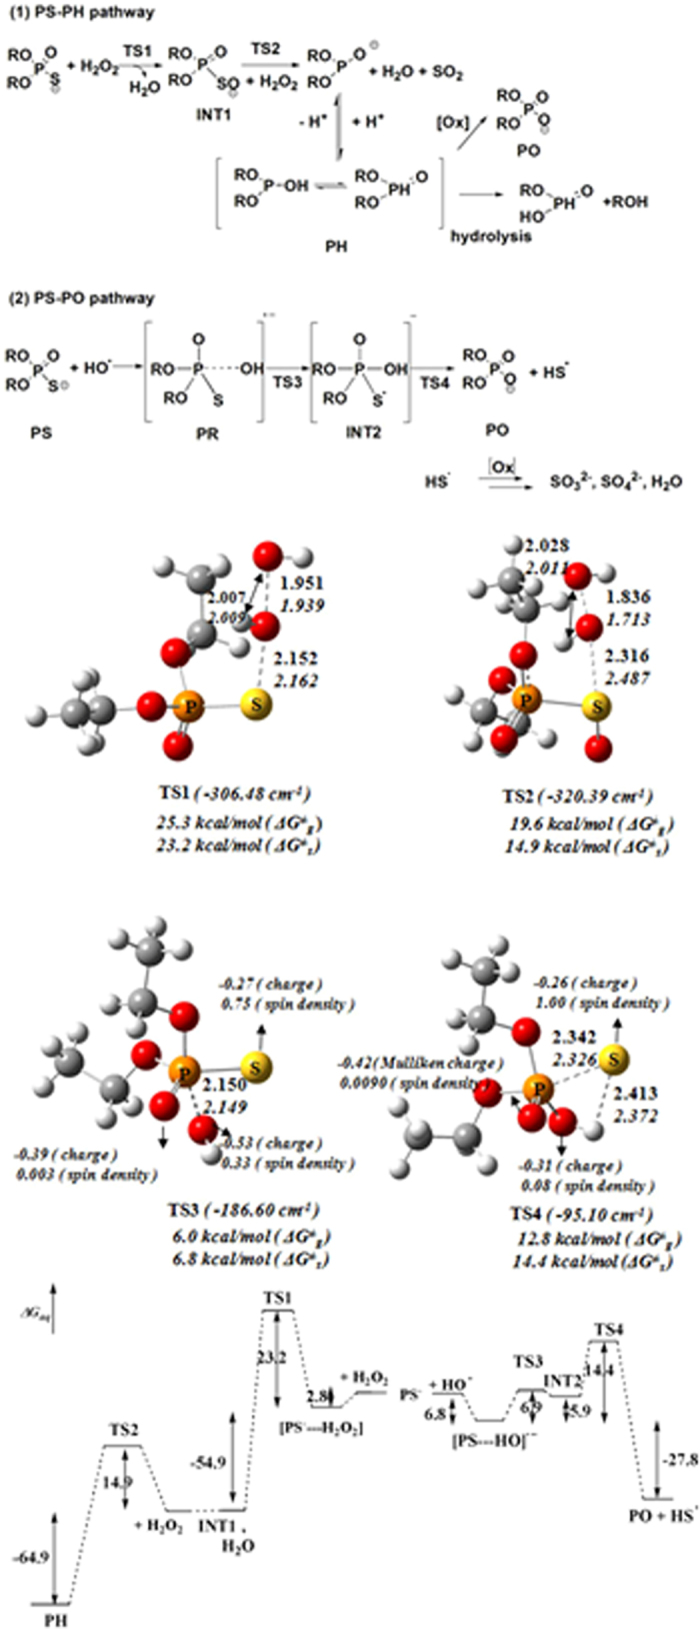
Figure 5. The PH and PO pathways, transition structures, and energy diagram of ROS-involving phosphorothioate oxidation at the M06 and B3LYP level of theory with the basis set of 6-311 + G(d, p).

(Distances in angstrom, and energetics in kcal/mol).

(Distances in angstrom, and energetics in kcal/mol).