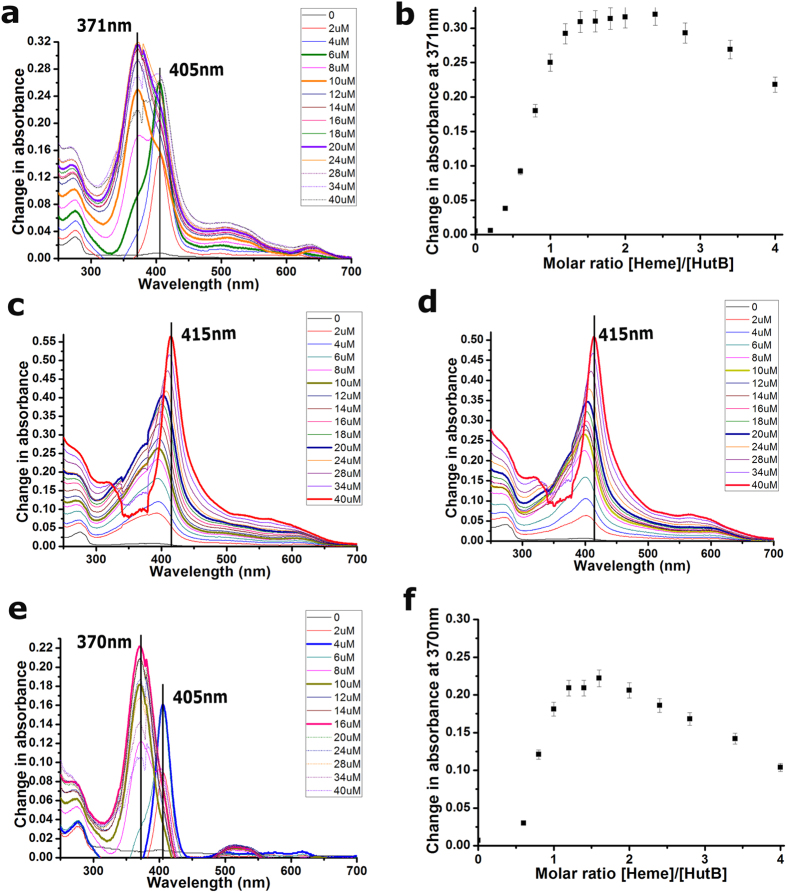
Figure 5. Hemin binding by VcHutB is observed by UV/VIS spectroscopy.
(a) VcHutB at pH 8.0 (no protein in the reference cuvette) was titrated with increasing amounts of hemin. Difference spectra (reference subtracted from sample) are shown for selected heme concentrations (colours as indicated). (b) Saturable heme binding is shown by plotting change in absorbance at 371 nm versus hemin concentration measured at pH 8.0. (c,d) Difference spectra for VcHutB-Y65A and VcHutB-Y65F at pH 8.0. (e) Titration of VcHutB at pH 7.0 with increasing amounts of hemin, by same method as of (a). (f) Change in absorbance at 370 nm versus hemin concentration indicates saturable heme binding at pH 7.0.

