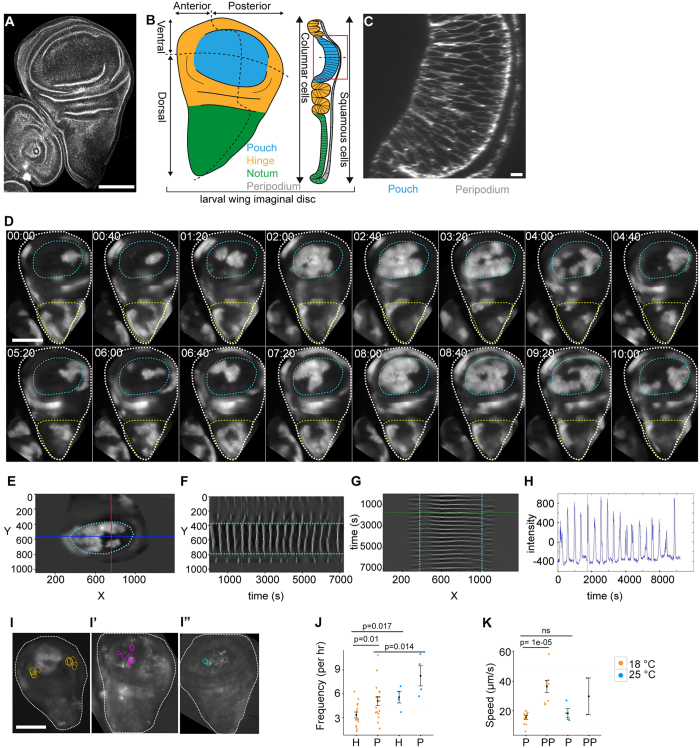
Figure 1. Oscillatory calcium waves in cultured imaginal discs ex situ.
(A) Confocal section (XY) of a third instar wing imaginal disc labeled with Phalloidin. (B) Schematic representation of wing disc domains, compartments and cell shapes. (C) Cross-section (XZ) of wing pouch shown in (A). (D) Time series (mm:ss) of a GCaMP-expressing third instar wing disc (white outline), indicating the position of the pouch (cyan outline) and notum (yellow outline). GCaMP reporter activity visualizes oscillatory calcium waves. Time series (Movie S1) starts when oscillatory calcium waves have fully developed (see Fig. 4). (E–G) Wing pouch (cyan outline) of a GCaMP-expressing wing disc indicating position of line sections (red and blue) at which kymograph profiles in (F) and (G) were generated. YT (F) and TX (G) kymographs visualize GCaMP intensity in grey values. Intersection with pouch borders are tracked in cyan. Green line in (F) and (G) indicates time point shown in (E). Note different oscillation frequencies in the pouch and ventral/dorsal hinge domains and the inability of waves to traverse the pouch border (F). Note coupling of wave front propagation between pouch and anterior/posterior hinge domains in (G). (H) GCaMP-sensor activity at the intersection of the red and blue line segments shown in (E) over time. Green line indicates time point shown in (E). (I–I”) 3 examples of GCaMP-expressing wing discs for which position of recurring wave initiation points were mapped in the pouch. Each circle represents an initiation event. (J) Oscillation frequency in hinge (H) and pouch(P) domains. n = 17 wing discs at rearing temperature of 18 °C (orange) and n = 4 discs at rearing temperature of 25 °C (blue). Imaging was performed at 23 °C. (K) Speed of wave front propagation in the pouch (P) and peripodium (PP). Larvae were reared at 18 °C (orange, n = 11 pouches, n = 8 peripodia) or at 25 °C (blue, n = 4 pouches, n = 2 peripodia). Imaging was performed at of 23 °C. Graphs display Mean ± SEM, p-values were determined using a one-tailed Mann-Whitney test. Scale bars represent 100 μm in (A,D and I–I”) and 5 μm in (C).

