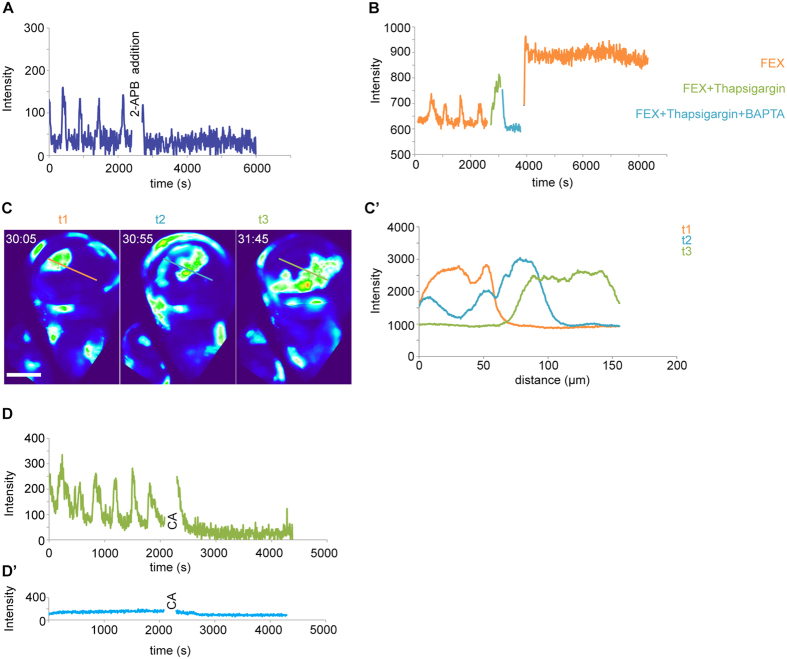
Figure 3. Oscillatory calcium waves depend IP3R, SOCE, ER-stored calcium and gap junction coupling.
(A) GCaMP-intensity over time, pre- and post- 2-APB treatment of a disc cultured in Schneider’s medium with 5% fly extract. Graph represents trace at one representative position in a disc (n = 3/3 discs). (B) G-CaMP-intensity over time for a disc cultured in Schneider’s medium with 5% fly extract (FEX, orange), followed by treatment with Thapsigargin in FEX (green) and BAPTA in FEX (blue) and again in Schneider’s medium with 5% fly extract (FEX). Graph represents trace at one representative position in a disc (n = 3/3 discs). (C,C’) Line segment profiles of GCaMP-intensities measured at three subsequent time points t1 (orange), t2 (blue) and t3 (green) during expansion of a single wave front. Time given as mm:ss. (D,D’) GCaMP-intensity over time, pre- and post-Carbenoxolone treatment of disc cultured in Schneider’s medium with 5% fly extract (D) or PBS (D’). Graph represents trace at one representative position in a disc (n = 3/3 discs). CA - Carbenoxolone addition to the medium. Scale bar represents 100 μm.

