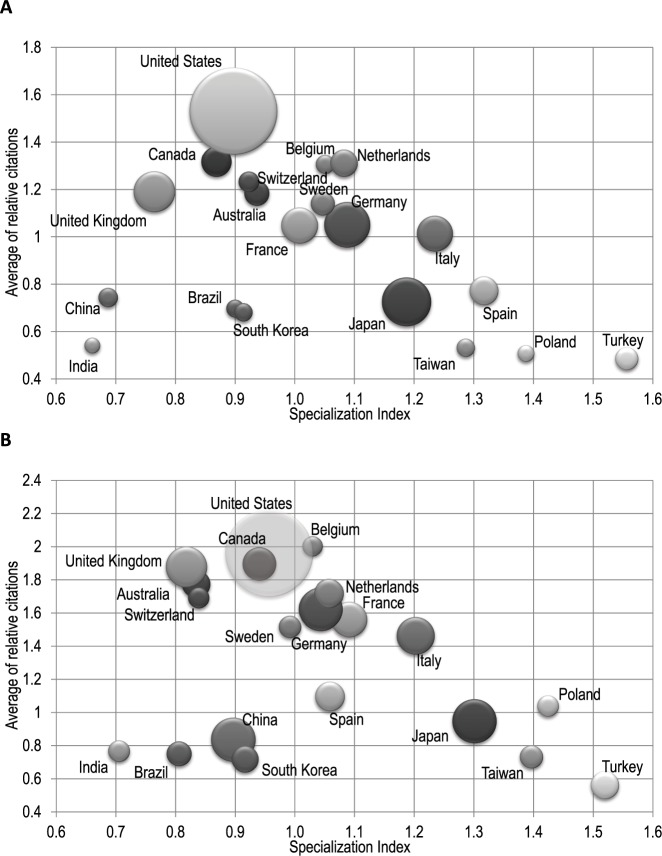
Figure 3.
Positional analysis of kidney research in 20 countries from 2000 to 2005 (A) and 2009 to 2014 (B). The y-axis shows ARCs for manuscripts, as an index of impact. The x-axis depicts the SI: When the SI is greater than 1.0, the country produces more kidney research manuscripts than expected, and the opposite is true when the index is less than 1.0. For Canada, both ARC and SI for kidney research (ie, includes KRESCENT trainees and all other kidney investigators) increased in 2009 to 2014, compared with 2000-2005.

