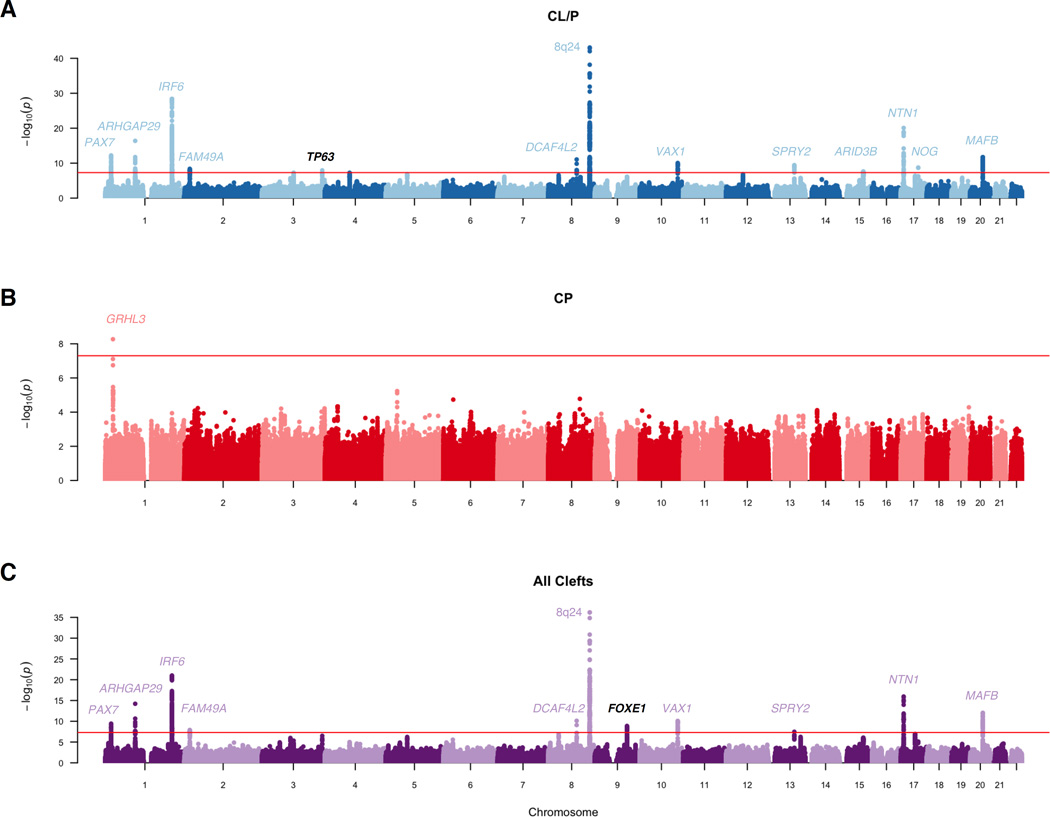
Figure 1. Manhattan plots for genome-wide meta-analyses.
(A) cleft lip with or without cleft palate (CL/P), (B) cleft palate (CP), (C) all orofacial clefts (CL/P plus CP). The red line denotes a Bonferroni-corrected genome-wide significant p-value (p < 5 × 10⁻⁸). Peaks are labeled with the candidate gene or closest gene in the region; colored labels indicate the locus was identified in a previous study, black labels indicate new loci.

