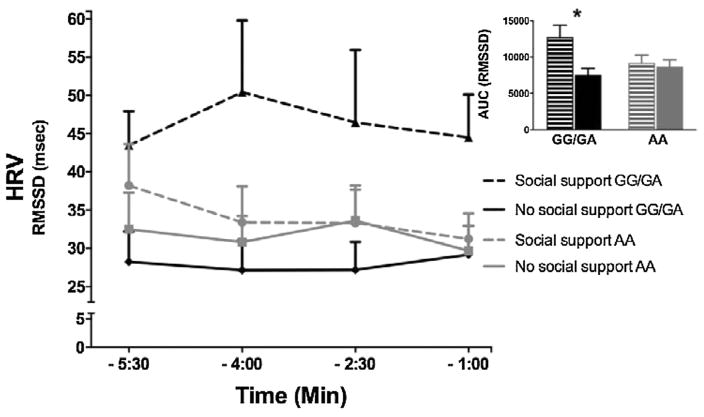
Fig. 1.
Mean HRV level of 90-s time segments during direct social interaction. Time specifications on the x-axis are relative to the start of the stress period. Error bars represent SEM. Insert: Area under the response curves (AUC) represent aggregated HRV levels through the four measurement points (90-s time segments). For an overview of the AUC means and SEMs see Table 2.

