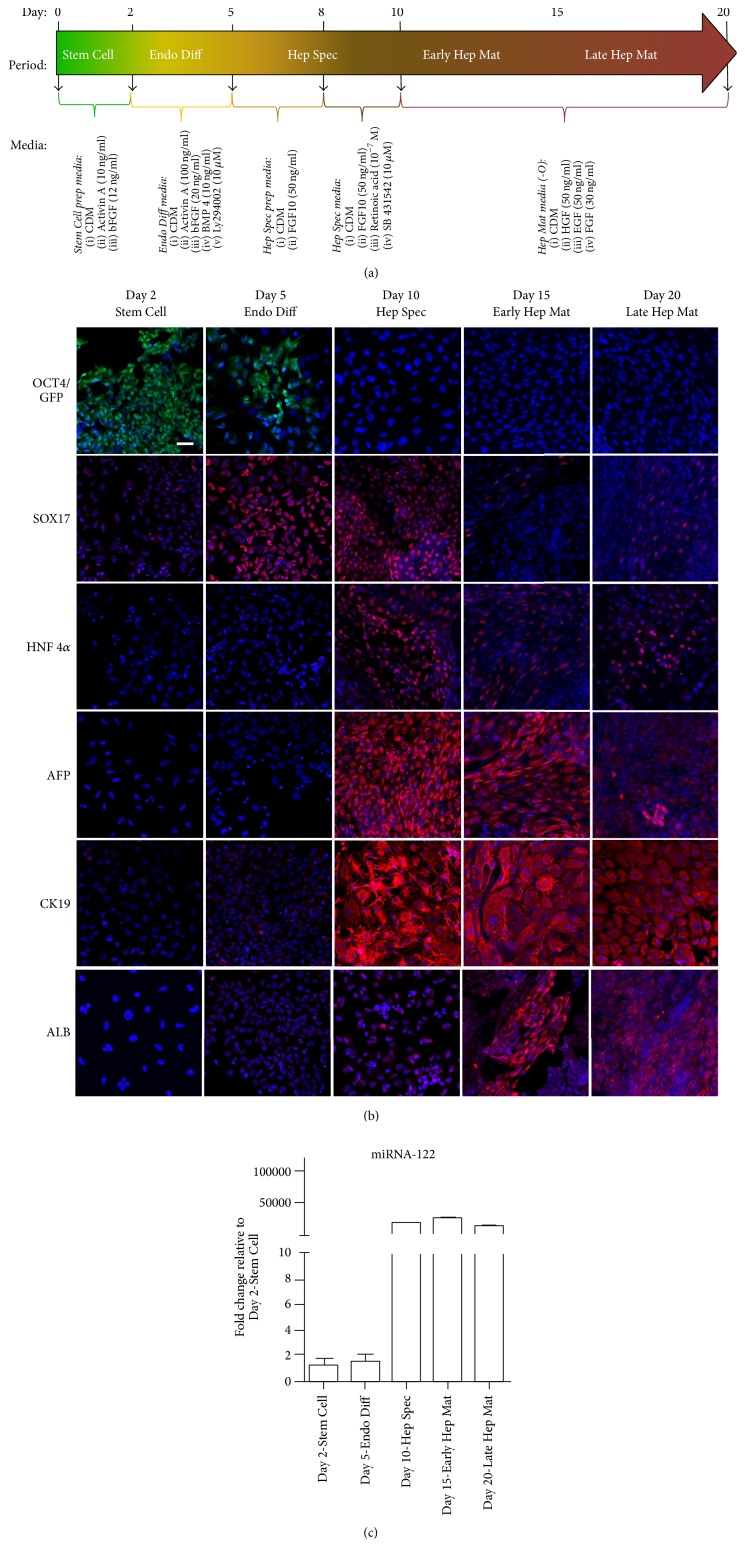
Figure 1.
(a) Schematic presentation of the differentiation protocol [14] used to measure the bioenergetics in the course of BG01V/hOG (hESC) line differentiation along the hepatic lineage. (b) Expression of the pluripotency marker OCT4 visualized by detection of EmGFP (in green) and immunofluorescence detection of the definitive endoderm marker SOX17 and the hepatic differentiation markers HNF4α, AFP, CK19, and albumin, all shown in red, in the course of BG01V/hOG (hESC) line differentiation along the hepatic lineage. Nuclei are highlighted with DAPI staining shown in blue. Scale bars represent 50 μm (50 microns). (c) Expression profile of miRNA-122 detected by real-time RT-PCR in the course of BG01V/hOG (hESC) line differentiation along the hepatic lineage.

