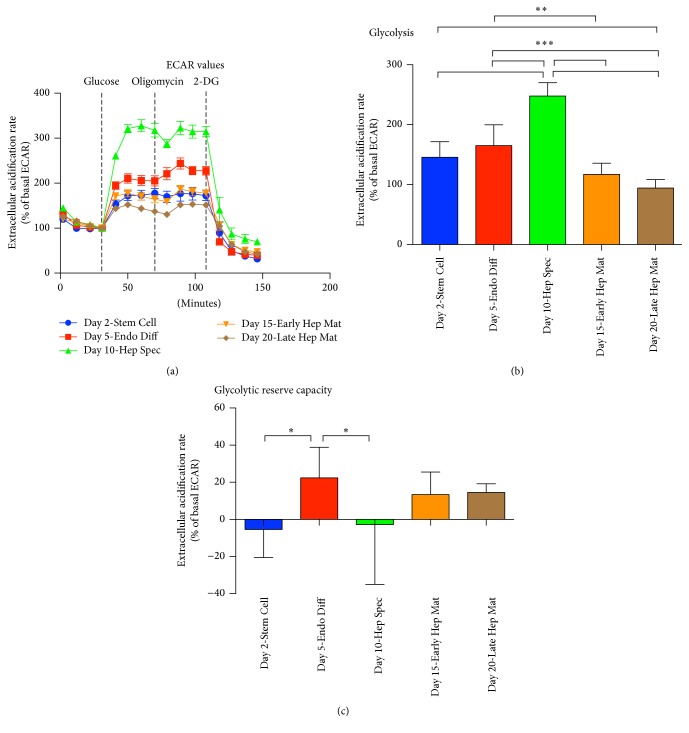
Figure 3.
Measurement of acidification rate at five successive time points in the course of BG01V/hOG (hESC) differentiation along the hepatic lineage. (a) Parameters of glycolysis were determined according to rate of acidification after addition of glucose, oligomycin, and 2-DG. (b) Rate of glycolysis was measured as increase of acidification rate after addition of glucose. (c) Glycolytic capacity was measured after addition of glucose and oligomycin (∗P < 0.05, ∗∗P < 0.01, and ∗∗∗P < 0.001; n = 8; error bars indicate SD).

