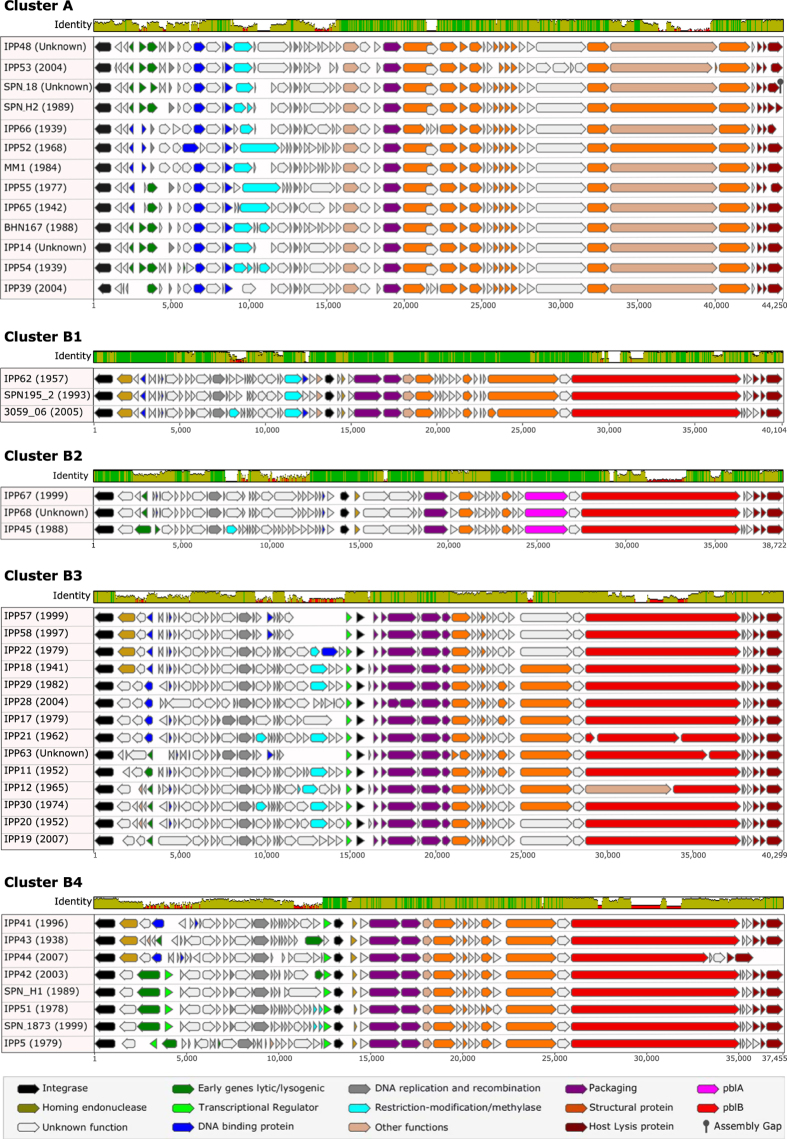
Figure 3. Nucleotide sequence alignments of representative full-length prophages from clusters A and B.
The coloured bar at the top of each cluster indicates the mean pairwise nucleotide sequence identity over all pairs in the column: bright green = 100% identity; green-brown = <100% but >30% identity; and red = <30% identity. Prophage genes are coloured based on putative or known function. The names of each prophage are given, followed by the year of isolation (in brackets) of the oldest known pneumococcus harbouring that prophage.

