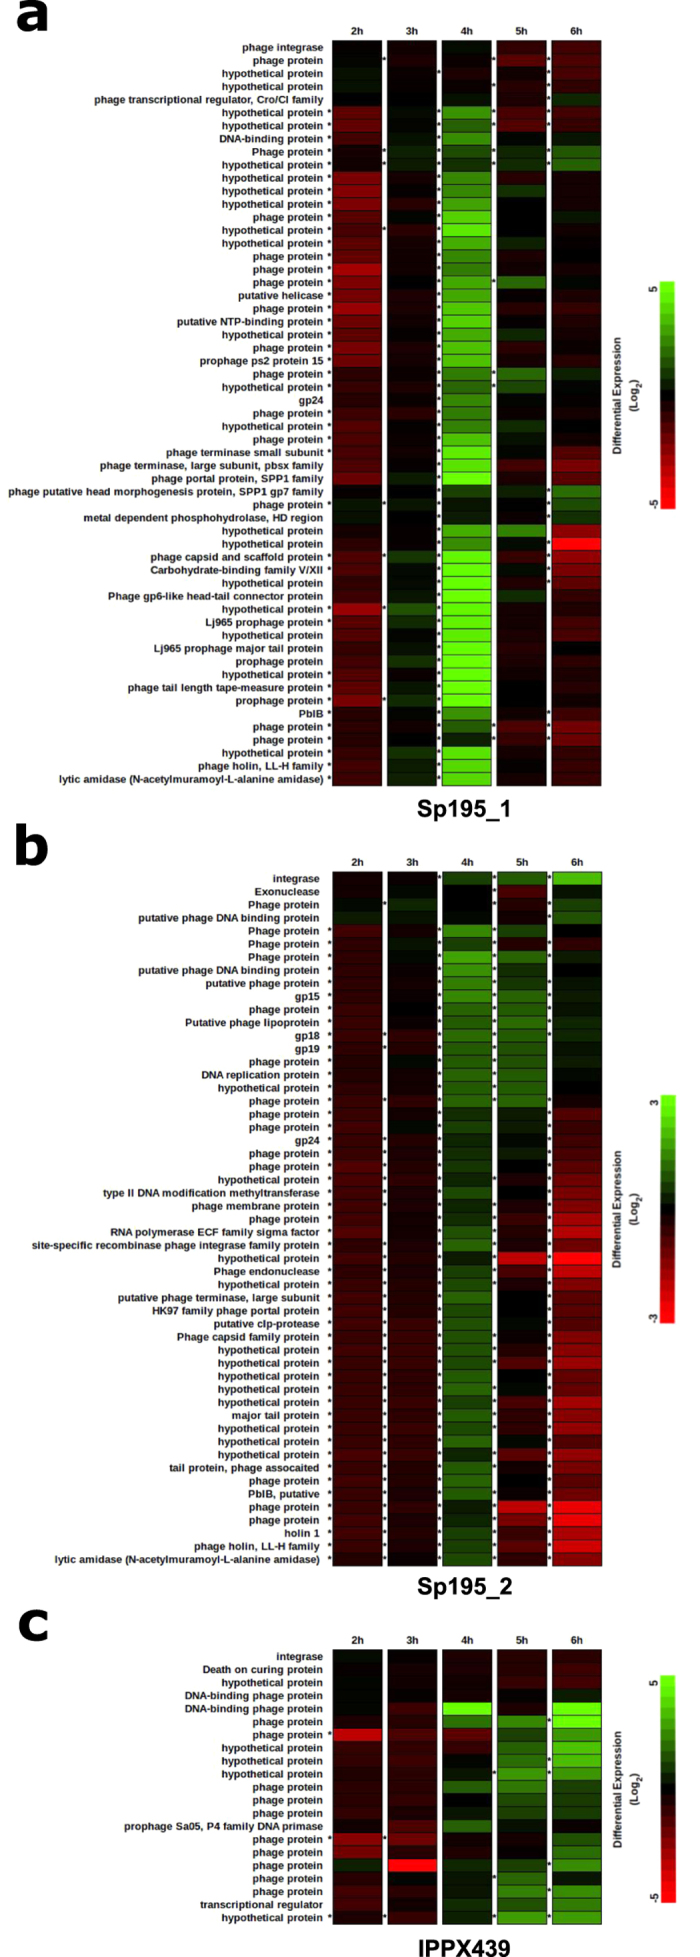
Figure 6. Heat maps describing the results of the RNA-seq experiment.

Prophage genes are depicted by rows and differential expression levels at each of five time points are presented in columns. An asterisk to the left of a cell indicates a statistically significant differential level of expression (p < 0.05). Prophage gene expression levels are given for two full-length prophages, Sp195_1 (a) and Sp195_2 (b), and one partial prophage sequence, IPPX439 (c). Mitomycin C was added to the broth culture after 3 h of incubation.
