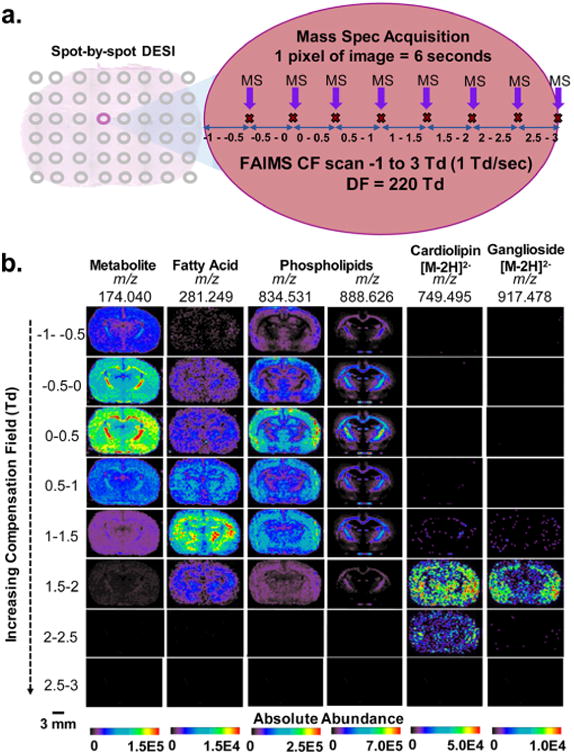
Figure 1.

2D-FAIMS, spot-by-spot DESI-MS imaging of a rat brain tissue section. (a) Schematic of the 2D FAIMS sweep experiment used to create multiple sets of DESI-MS ion images at varied CF values in one tissue section. Each 200 μm spot on the tissue was analyzed for 6 s for a total of 8 MS acquisitions, in which a FAIMS sweep occurred, allowing MS acquisition correlated to different CF ranges. (b) DESI-FAIMS-MS ion images for a rat brain tissue section for 6 representative lipid and metabolite species, each acquired at DF = 220 Td and a different CF range, thus highlighting the increased transmission of different molecular species at each CF value. Small metabolites transmit at the lowest CF (–1 to +0.5 Td), followed by FA and singly charged complex lipids at midrange CF (0.5–1.5 Td), and doubly charged CL and gangliosides at the high-range CF (1.5– 2.5 Td). The images for each ion (vertical columns) are normalized to the highest ion intensity of that ion, and not across all ions. Scale bar = 3 mm.
