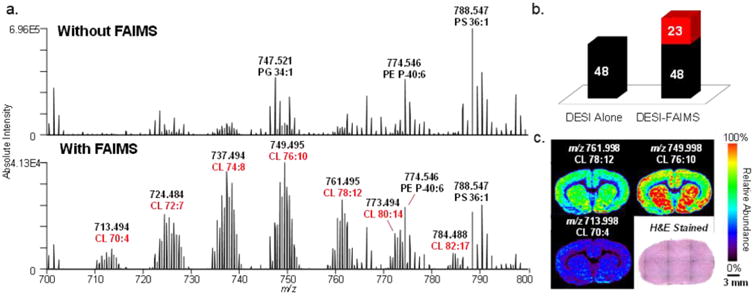
Figure 2.

Static DESI-FAIMS-MSI of CL in rat brain tissue. (a) Representative negative ion mode DESI mass spectra acquired without and with FAIMS in the m/z 700–800 range at the optimized doubly charged CL parameters (DF = 220 Td, CF = 2.20 Td), showing a clear increase in the relative abundance of CL species. Without FAIMS and with FAIMS spectra are averages of one DESI line scan, consisting of 68 and 66 scans, respectively. (b) Chart of CL species detected with DESI alone and the DESI-FAIMS integrated approach. (c) 2D DESI-FAIMS ion images for selected CL species (spatial resolution of 200 μm). Voxel versions of the same ion images are shown in Figure S15.
