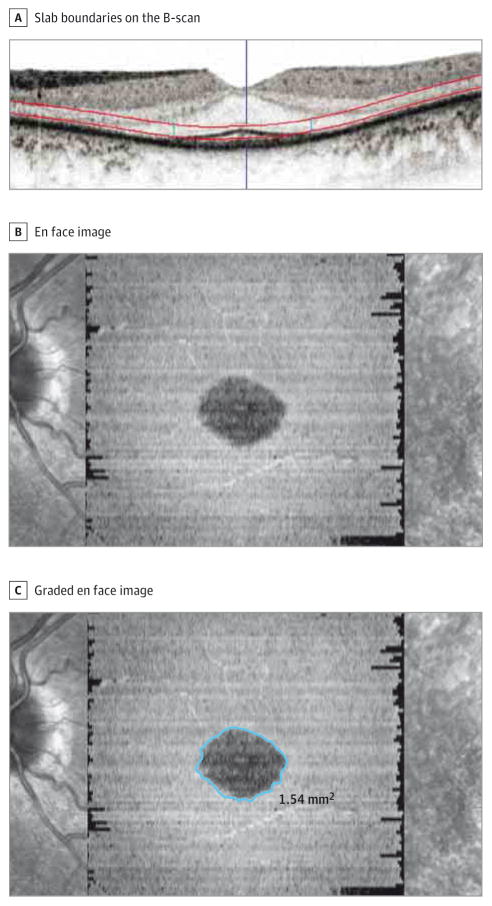
Figure 2. Generation of Graded en Face Spectral Domain–Optical Coherence Tomographic (SD-OCT) Image.
A, Red lines on the B-scan illustrate the slab boundaries used to generate the en face SD-OCT image. B, En face SD-OCT image. C, Graded en face image using the “draw region” tool in the SD-OCT manufacturer’s software. The exact location of the drawn boundary on all corresponding B-scans is discernible (2 small vertical blue lines within the slab in part A).

