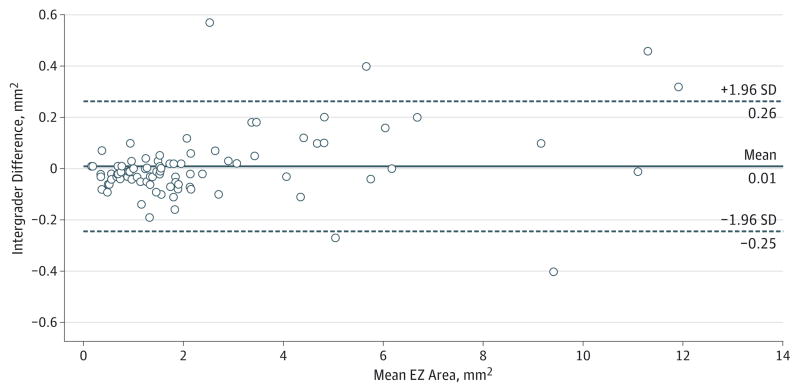
Figure 3. Bland-Altman13 Plot of Intergrader Reproducibility.
Comparison of the measurement of the ellipsoid zone (EZ) area on en face spectral domain–optical coherence tomographic images between the 2 graders is shown. The mean preserved EZ area is calculated from measurements by both graders. Data points indicate individual images (45 eyes).

