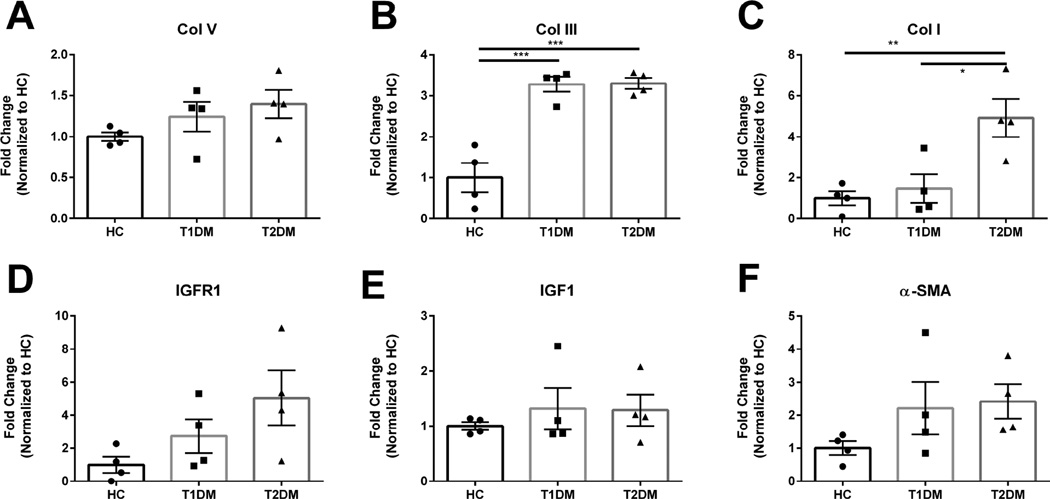
Figure 1. Expression of Collagen I, III, V, and α-smooth muscle actin (α-SMA), insulin growth factor-1 (IGF-1) and insulin growth factor-1 Receptor (IGFR-1).
(A) Representative Western blots and (B–G) quantification of bands normalized to loading control. n≥4 for HC, T1DM, and T2DM corneal buttons. Error bars represent standard error of the mean. A one-way ANOVA was performed and P≤0.05 considered statistically significant. Each data point corresponds to individual patients.

