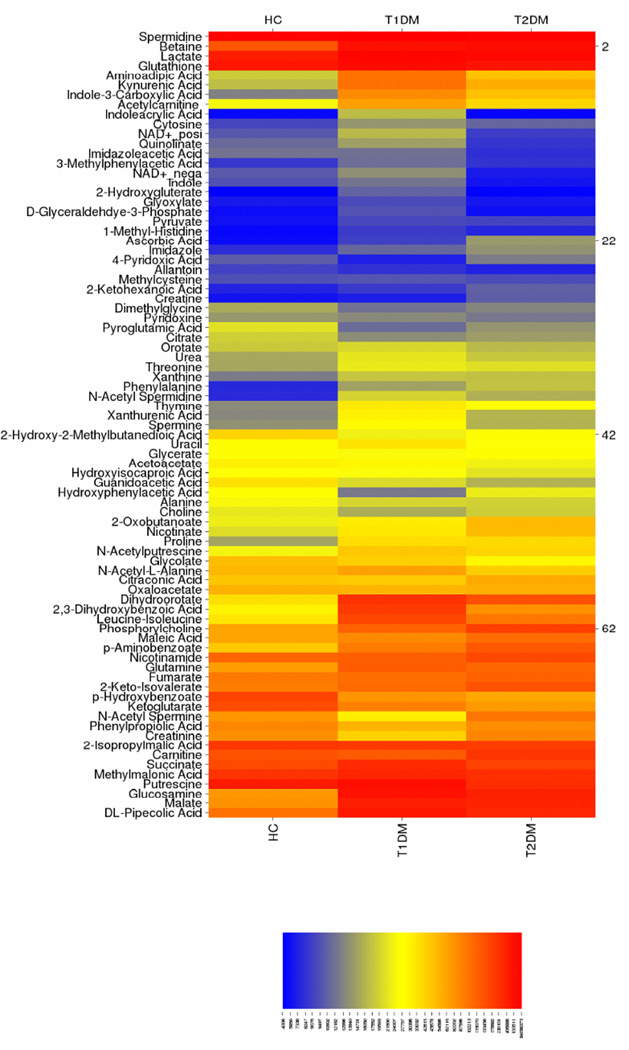
Figure 2. Heat map of metabolites isolated from corneal stromal tissue from healthy controls (HC), Type 1 (T1DM) and Type 2 (T2DM) diabetic mellitus patients.
Color scheme depicts metabolite present in high amounts (orange), intermediate amounts (yellow), and low amounts (blue). Metabolites at similar concentrations are grouped together along the y-axis. n≥3 for HC, T1DM, and T2DM corneal buttons.

