. 2016 Feb 29;8(15):7914–7922. doi: 10.1039/c6nr00712k

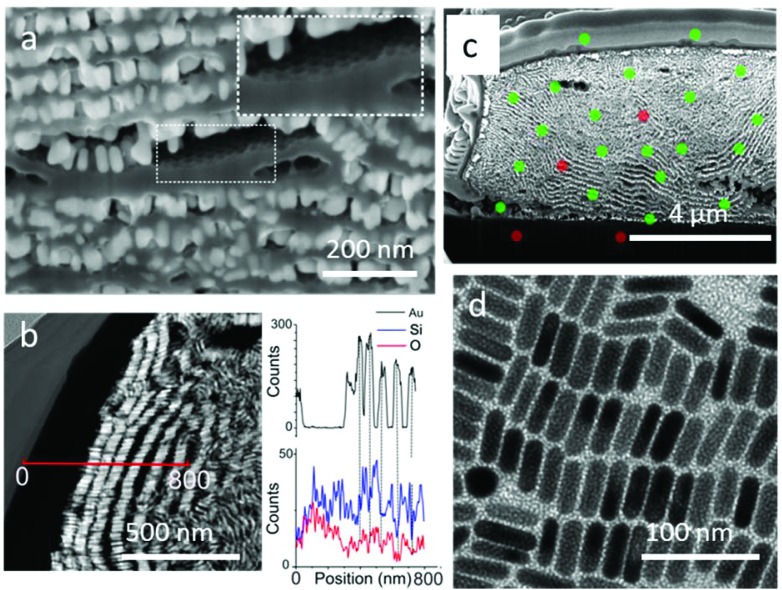
Fig. 6. Evidence of the infiltration of porous silica between gold nanorod monolayers. (a) SEM image at high magnification. The inset shows a honeycomb lattice formed in a silica layer as a result of the imprint of the hexagonal GNR lattice. (b) HAADF STEM image of a GNR-silica supercrystal section. The red line indicates the position of the EDX line scan corresponding to the graphs representing the intensity of Au (top), Si and O (bottom) EDX signals as a function of the position. (c) SEM image of a gold–silica supercrystal section incubated with a 1.5% uranyl acetate solution overnight and subsequently cut by FIB. Green spots indicate detection of uranium in EDX whereas red spots indicate that the signal was too low to be detected via EDX. (d) TEM images of gold nanorods deposited onto a carbon coated TEM grid by the PDMS driven process and then covered by a mesoporous silica film.

Fig. 6