. 2016 Aug 17;52(85):12555–12569. doi: 10.1039/c6cc05613j

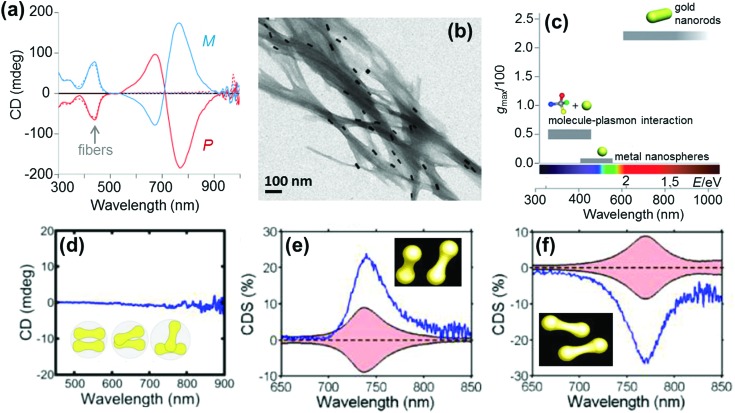
Fig. 12. (a) CD spectra of P (red) and M (blue) nanocomposites. (b) TEM image of the M nanocomposite exhibiting twisted fibers with nanorods adsorbed on the surface. (c) Representative values of anisotropy factors and the corresponding typical spectral ranges for metal NPs in fluid media. Reproduced with permission from ref. 146. Copyright 2011 Wiley VCH. (d) Ensemble CD spectra of the Au nanodumbbell dimer (no peaks were observed). The inset shows the cartoon depiction of the dimers. (e and f) Experimental single particle CD scattering spectra of the two Au nanodumbbell dimers with twisted side-by-side geometry (the dimers show opposite signs, as expected for two enantiomers). Adapted with permission from ref. 149. Copyright 2016 American Chemical Society.

Fig. 12