. 2016 Aug 17;52(85):12555–12569. doi: 10.1039/c6cc05613j

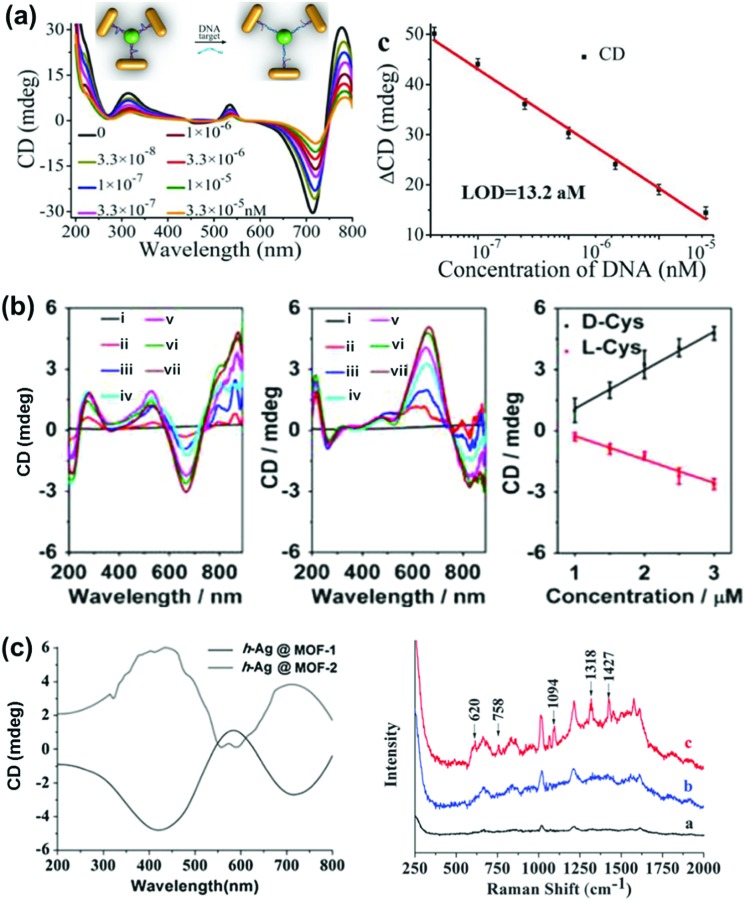
Fig. 14. (a) DNA detection using NR tetramer assemblies. CD curves with increasing concentrations of DNA solution and the CD calibration curves for DNA detection. The longitudinal absorption peak of the NRs used for assembly was 750 nm. The inset shows the schematic illustration for DNA biosensing. Adapted with permission from ref. 151. Copyright 2016 Wiley VCH. (b) Cysteine and glutathione sensing using NRs. CD spectral changes of Au NRs upon addition of l- and d-cysteine. The concentration of cysteine is (i) 0, (ii) 1, (iii) 1.5, (iv) 2.0, (v) 2.5, (vi) 3.0 and (vii) 5 μM. Linear relationship between CD signals at 670 nm and the added concentration of d-Cys or l-Cys. Adapted with permission from ref. 154. Copyright 2016 American Chemical Society. (c) SERS sensor based on Ag NPs@homochiral MOF. CD and the corresponding SERS spectra of (i) h-Ag NPs@MOF-1, (ii) h-Ag NPs@MOF-2 with 1.0 μmol L–1 d-cysteine and (iii) h-Ag NPs@MOF-1 with 1.0 μmol L–1 l-cysteine. Reproduced with permission from ref. 157. Copyright 2016 Royal Society of Chemistry.

Fig. 14