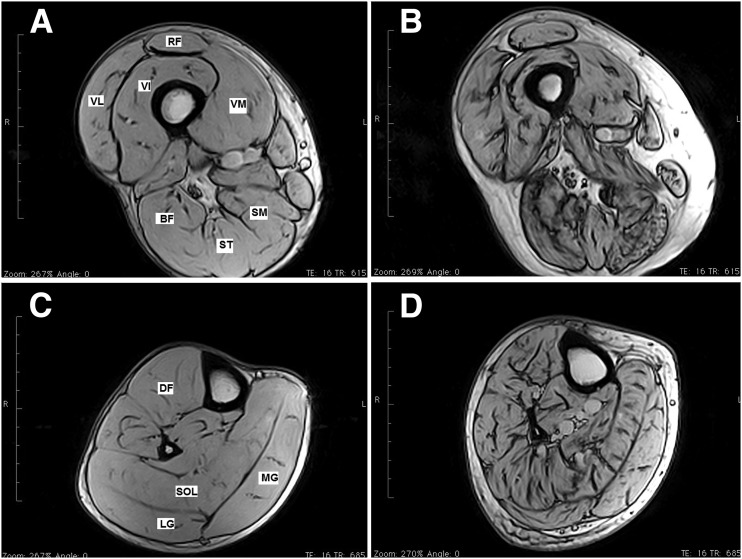
Figure 1.
MRI images of the lower limbs of control subjects vs. patients with type 2 diabetes. Representative lower-limb MRI images from a healthy 69-year-old control group volunteer (A and C) and a 67-year-old patient with diabetic polyneuropathy (B and D). Images are from the midthigh level (A and B) and midtibia level (C and D). Note the substantial increase in IMNCT (dark areas inside the muscle cross-sections are connective tissue) in images from the patient with diabetes. Scale bar = 10 cm. BF, biceps femoris; DF, dorsiflexor; LG, lateral gastrocnemius; MG, medial gastrocnemius; RF, rectus femoris; SM, semimembranosus; SOL, soleus; ST, semitendinosus; VI, vastus intermedius; VL, vastus lateralis; VM, vastus medialis.

