Figure 2.
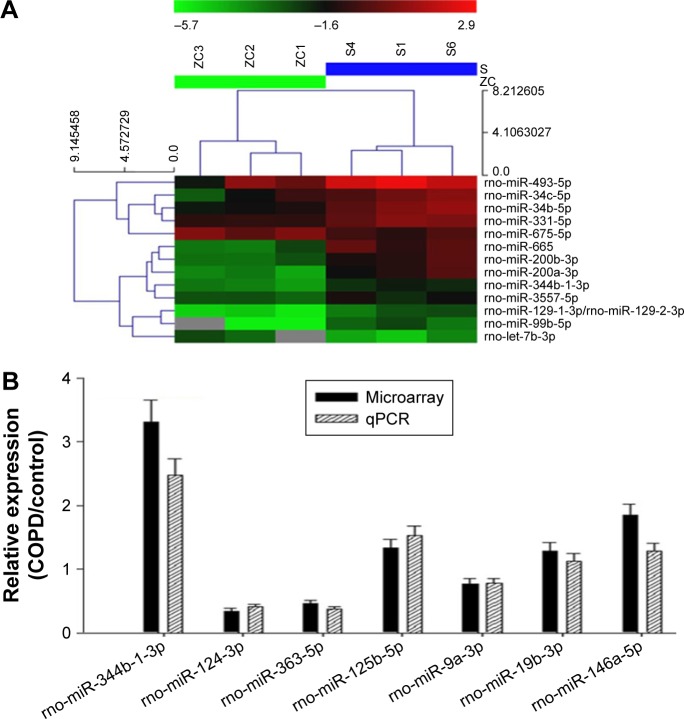
Expression profile and validation of selected miRNAs in AMs from COPD rats.
Notes: (A) miRNA arrays of AMs. The expression change indicated by the color bar was calculated by comparing the miRNA expression levels in AMs from COPD rats with those in control. Only differentially expressed miRNAs pass fold change filtering (≥2-fold change). The values presented are the mean of triplicate samples. (B) Comparison of expression levels of seven differentially expressed miRNAs in microarray and real-time PCR assay. Data are presented as mean ± SD of three independent tests with triplicate samples. The miRNA expression was normalized against an endogenous U6 RNA control.
Abbreviations: AMs, alveolar macrophages; miRNA, microRNA; qPCR, quantitative polymerase chain reaction; PCR, polymerase chain reaction; SD, standard deviation.

