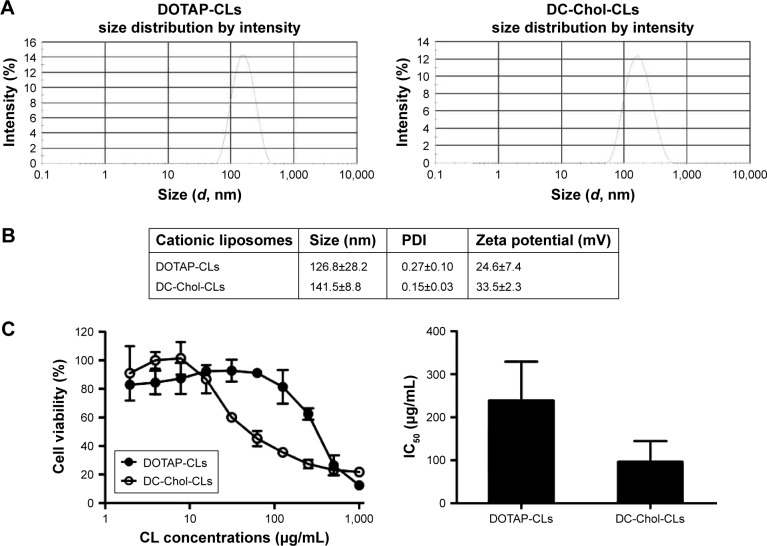
Figure 2.
Characterization of CLs and their cytotoxicity in BMDCs.
Notes: (A) Shown are representative, intensity-based size distributions of DOTAP-CLs and DC-Chol-CLs as determined by DLS. (B) The average size, PDI, and zeta potential of CLs are shown. Data are expressed as mean ± SD (n =9). (C) CLs at a series of concentrations were incubated with BMDCs overnight, and cellular viability was measured using the CCK-8 assay. Left panel: shown are the representative cell viability data. Right: the IC50 values of DOTAP-CLs and DC-Chol-CLs on BMDCs are shown. Data represent the mean ± SD from at least three repeated experiments with n =3.
Abbreviations: BMDCs, bone marrow-derived dendritic cells; CCK-8, Cell Counting Kit-8; CLs, cationic liposomes; DC-Chol, 3β-[N-(N′,N′-dimethylaminoethane)-carbamoyl] cholesterol; DLS, dynamic light scattering; DOTAP, 1,2-dioleoyl-3-trimethylammonium-propane; PDI, polydispersity index.

