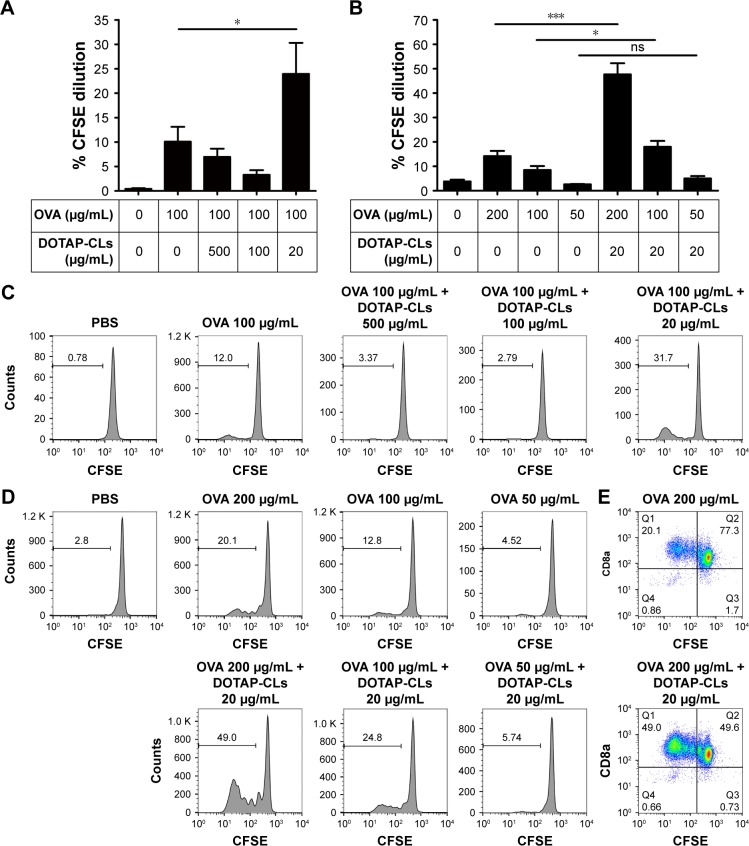
Figure 3.
DOTAP-CLs promote antigen cross-presentation by BMDCs.
Notes: (A) The percentage of OT-I CD8+ T-cells that proliferated after coculture with BMDCs pulsed with OVA in the presence of different doses of DOTAP-CLs. (B) The percentage of OT-I CD8+ T-cells that proliferated after coculture with BMDCs pulsed with OVA in the presence or absence of 20 μg/mL DOTAP-CLs. (C) Representative flow cytometric histograms of (A) are shown. (D) Representative flow cytometric histograms and (E) scatter plots from (B) are shown. The data were analyzed by one-way ANOVA, followed by a multiple comparison post-test. *P<0.05; ***P<0.001. Data represent the mean ± SD from at least three repeated experiments with n =4–6 for (A) and n =2–4 for (B).
Abbreviations: ANOVA, analysis of variance; BMDCs, bone marrow-derived dendritic cells; CFSE, carboxyfluorescein diacetate N-succinimidyl ester; CLs, cationic liposomes; DOTAP, 1,2-dioleoyl-3-trimethylammonium-propane; ns, not significant; OVA, ovalbumin; PBS, phosphate-buffered saline.

