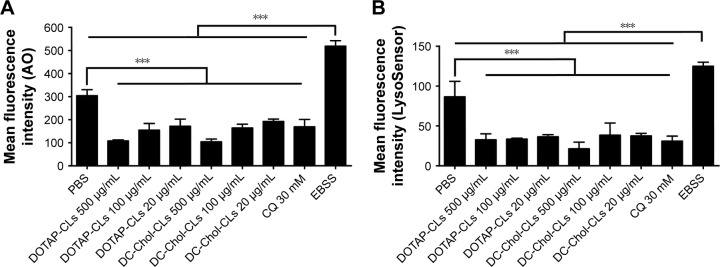
Figure 5.
CLs interfere with the acidification of lysosomal pH in BMDCs.
Notes: (A) The mean fluorescence intensity of BMDCs stained with AO after CL treatment. After BMDCs were treated with indicated groups overnight, BMDCs were stained by AO, followed by the measurement of AO signal with flow cytometric analysis. (B) The mean fluorescence intensity of BMDCs stained with LysoSensor Green DND-189 dye after CL treatment. After BMDCs were treated with indicated groups overnight, BMDCs were stained by LysoSensor, followed by the measurement of LysoSensor signal with flow cytometric analysis. The data were analyzed by one-way ANOVA, followed by a multiple comparison post-test. ***P<0.001. Data represent the mean ± SD from at least three repeated experiments with n =3–4.
Abbreviations: ANOVA, analysis of variance; AO, acridine orange; BMDCs, bone marrow-derived dendritic cells; CLs, cationic liposomes; CQ, chloroquine; DC-Chol, 3β-[N-(N′,N′-dimethylaminoethane)-carbamoyl] cholesterol; DOTAP, 1,2-dioleoyl-3-trimethylammonium-propane; EBSS, Earle’s balanced salt solution; PBS, phosphate-buffered saline; SD, standard deviation.

