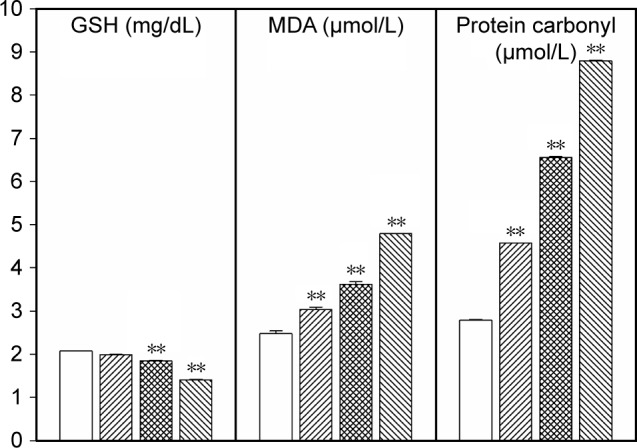
Figure 6.

Antioxidant status of GSH, MDA, and the protein carbonyl group levels in blood after treatment with AAPH at 10 ▨, 20 ▩, and 40 ▧ mmol/L when compared to non-AAPH treatment (white bar □).
Note: **P<0.01 when compared to non-AAPH-treated blood (white bar).
Abbreviations: GSH, glutathione; MDA, malondialdehyde; AAPH, 2,2′-azobis (2-amidinopropane) dihydrochloride.
