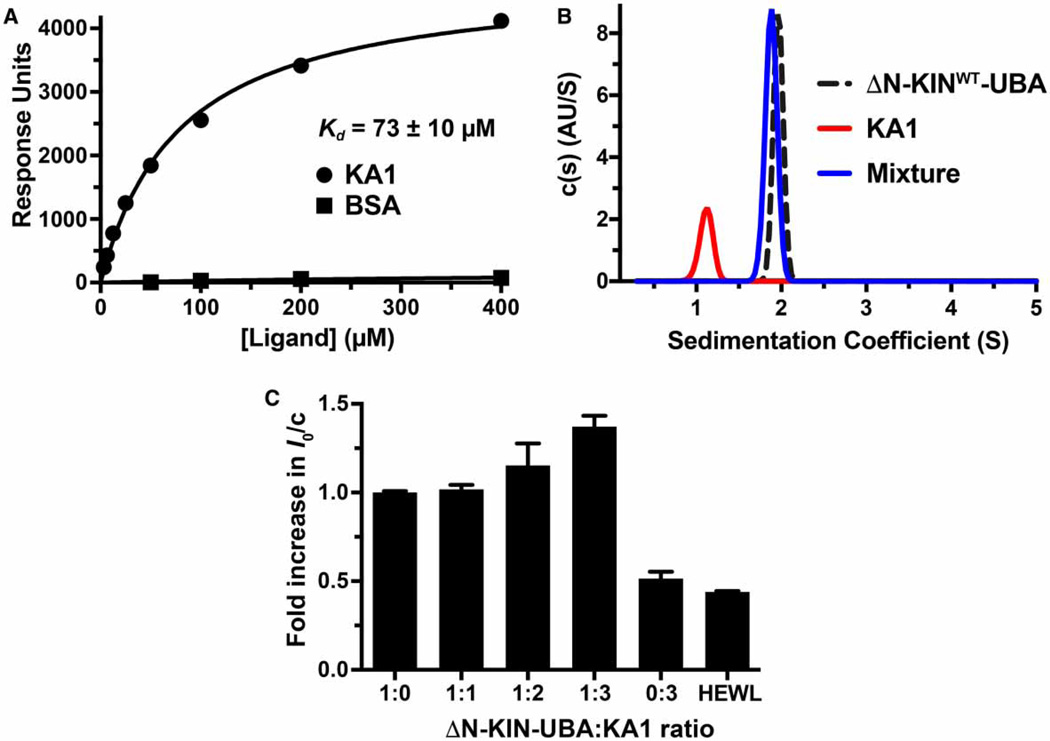
Figure 2. Evidence for direct binding of the MARK1 KA1 domain to the kinase–UBA domain fragment.
(A) SPR analysis of the MARK1 KA1 domain binding to the MARK1 kinase–UBA domain fragment (residues 45–371: ΔN-KINWT-UBA) immobilized on a CM5 sensor chip. The binding curve shown is representative of three independent repeats. Fitting to each individual binding curve yields a mean Kd value (±standard deviation) of 73 ± 10 mM for the KA1 domain. No binding was observed for the BSA control. Note that ΔN-KINWT-UBA from which the hexahistidine tag had not been proteolytically removed was used for these studies. (B) Analytical ultracentrifugation sedimentation velocity c(s) distribution analysis of tag-cleaved kinase–UBA domain fragment at 35 mM (black dashed trace), 35 mM KA1 domain alone (red trace), and a mixture of both (blue trace). The fact that there is no detectable free KA1 domain in this mixture suggests that the apparent affinity in this assay is stronger than that measured in the SPR experiment, which could result from restrictions on KA1 binding imposed by covalent immobilization of the kinase–UBA fragment on the SPR sensor chip. Note also that the sedimentation coefficient for the mixture is slightly smaller than that for the kinase–UBA alone, suggesting that the complex may be more compact. Similar c(s) distributions were obtained for two independent protein preparations. (C) Normalized I0 SAXS analysis of the tag-cleaved kinase–UBA domain fragment held at 140 µM (5.3 mg/ml) as KA1 domain was added in trans at increasing concentrations from 140 µM (1:1 ratio) to 420 µM (1:3 ratio). The KA1 domain-only control contained 420 µM protein, and the hen egg white lysozyme (HEWL) control was at 700 µM (10.5 mg/ml). The mean values from three independent experiments (±standard deviation) are shown, with the exception of the 1:3 ratio sample, for which data for two protein preparations are shown (each measured in triplicate). Rg and Dmax values for all samples are listed in Supplementary Table S1.

