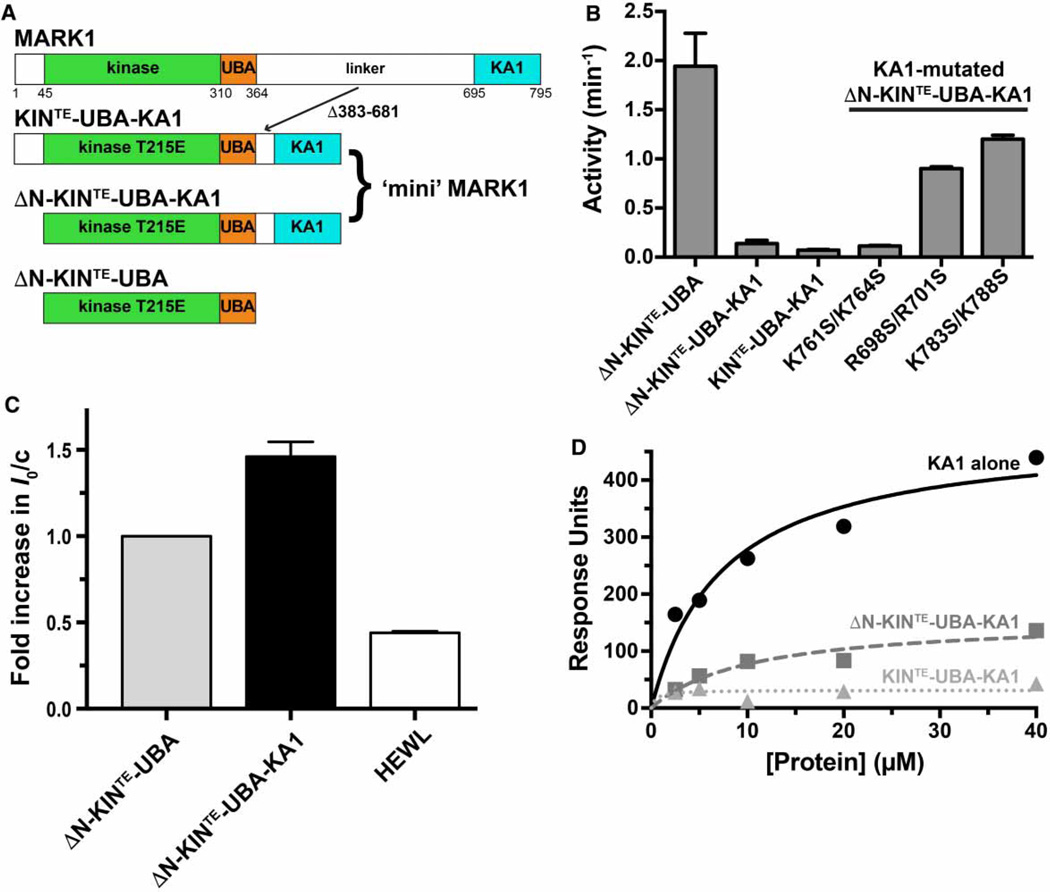
Figure 5. Intramolecular autoinhibition of MARK1 by the KA1 domain.
(A) Diagram of MARK1 constructs. Full-length MARK1 is shown at the top, and ‘mini’ MARK1 was generated by deleting residues 383–681 from the linker between the UBA and KA1 domains, to yield KIN-UBA-KA1. The T215E activation loop phosphomimetic mutation was also introduced to yield KINTE-UBA-KA1. A second ‘mini’ MARK1 construct is identical except that it lacks the N-terminal 44 residues (ΔN-KINTE-UBA-KA1), and a T215E version of the kinase–UBA domain fragment (ΔN-KINTE-UBA) was also generated. All constructs contain an N-terminal hexahistidine tag. (B) A comparison of the kinase activities of KINTE-UBA-KA1 and ΔN-KINTE-UBA-KA1 (assayed at 5 µM) with that of ΔN-KINTE-UBA (assayed at 0.5 µM) shows that KA1 domain deletion from ‘mini’ MARK1 increases activity by ~25-fold or more. Enhanced activity of variants of ΔN-KINTE-UBA-KA1 with a mutated KA1 domain (assayed at 1 µM) further shows that alterations that disrupt kinase inhibition in trans by the KA1 domain (R698S/R701S or K783S/K788S; Figure 4) increase the activity of ‘mini’ MARK1 by ~12–17-fold. By contrast, permissive mutations (K761S/K764S) have no effect. Activities were assayed in triplicate, and mean values ± standard deviation plotted. (C) SAXS analysis shows that the weight-average molecular weight (MW) of tag-cleaved ΔN-KINTE-UBA-KA1 (at 140 µM) plotted as a relative I0 value is 1.4-fold greater than that for ΔN-KINTE-UBA (at 140 µM). Comparison with Figure 2C shows that the addition of the KA1 domain in trans has the same effect on I0 as appending it in cis, increasing I0/c by the same factor (~1.4), and increasing Rg from 28.1 ± 0.4 Å (for ΔN-KINTE-UBA) to 31.7 ± 1.7 Å for ΔN-KINTE-UBA-KA1 and Dmax from 75 to 95 Å — similar to the increases seen when KA1 domain is added in trans (Supplementary Table S1). A HEWL control is also shown. The mean and standard deviations for at least three measurements from two independent protein preparations are shown. (D) SPR analysis of binding to membranes containing acidic phospholipids for the isolated MARK1 KA1 domain, ΔN-KINTE-UBA-KA1 ‘mini’ MARK1, and KINTE-UBA-KA1 ‘mini’ MARK1. DOPC membranes containing 20% (mole/mole) PS were immobilized on L1 sensor chips as described previously [12]. Binding curves are representative of at least three independent repeats and were fit separately. The Kd value (±standard deviation) estimated for the MARK1 KA1 domain binding to these vesicles was 7.4 ± 2.6 µM. Neither ΔN-KINTE-UBA-KA1 nor KINTE-UBA-KA1 ‘mini’ MARK1 gave robust signals, and binding was too weak to quantitate.

