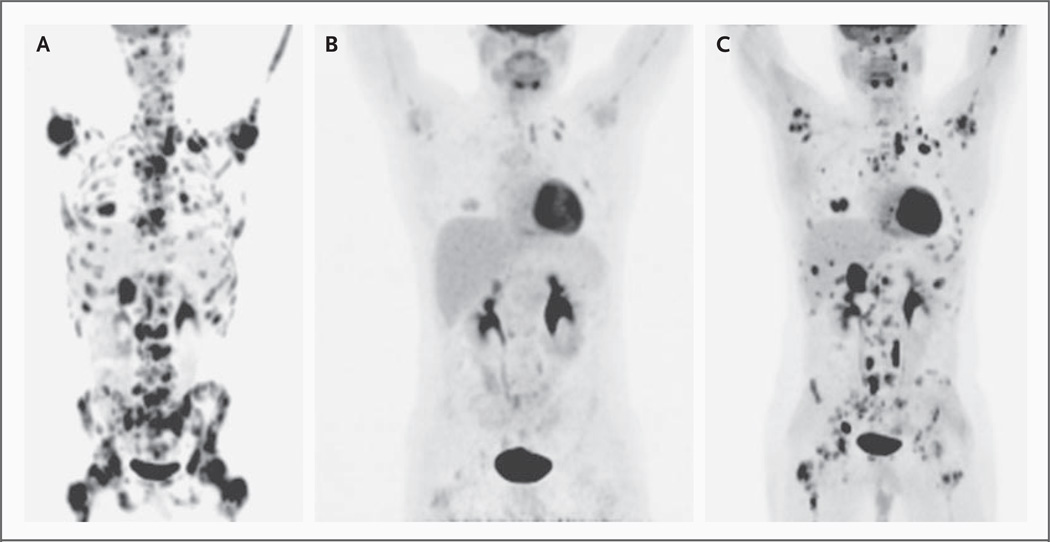
Figure 1. Tumor Response on Positron-Emission Tomographic (PET) Scanning.
Whole-body projections from 18F-fluorodeoxyglucose (FDG)–PET scans are shown. Panel A shows the pretreatment scan; Panel B, the repeat scan after 2 months of therapy with the hedgehog pathway inhibitor GDC-0449; and Panel C, the repeat scan after 3 months of therapy.

