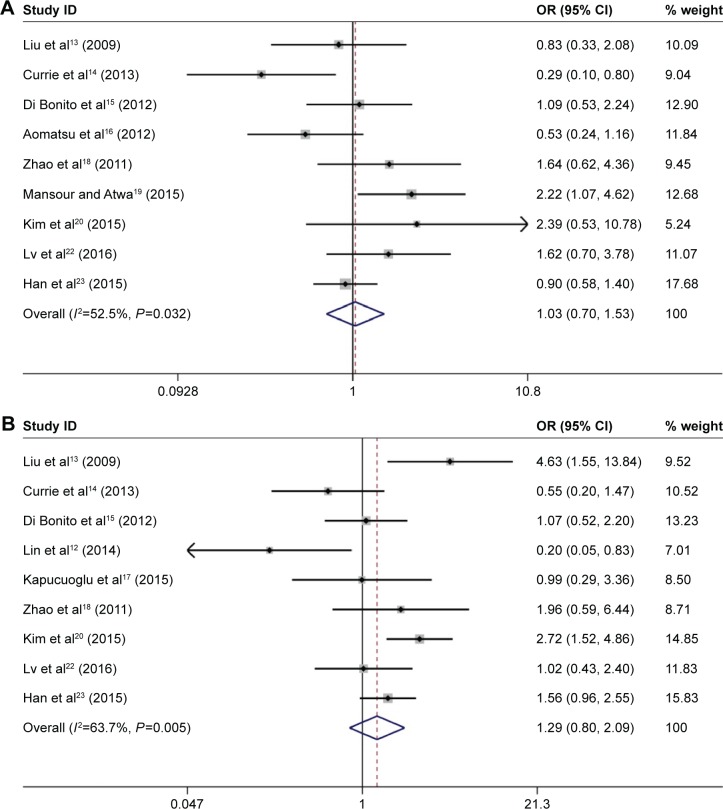
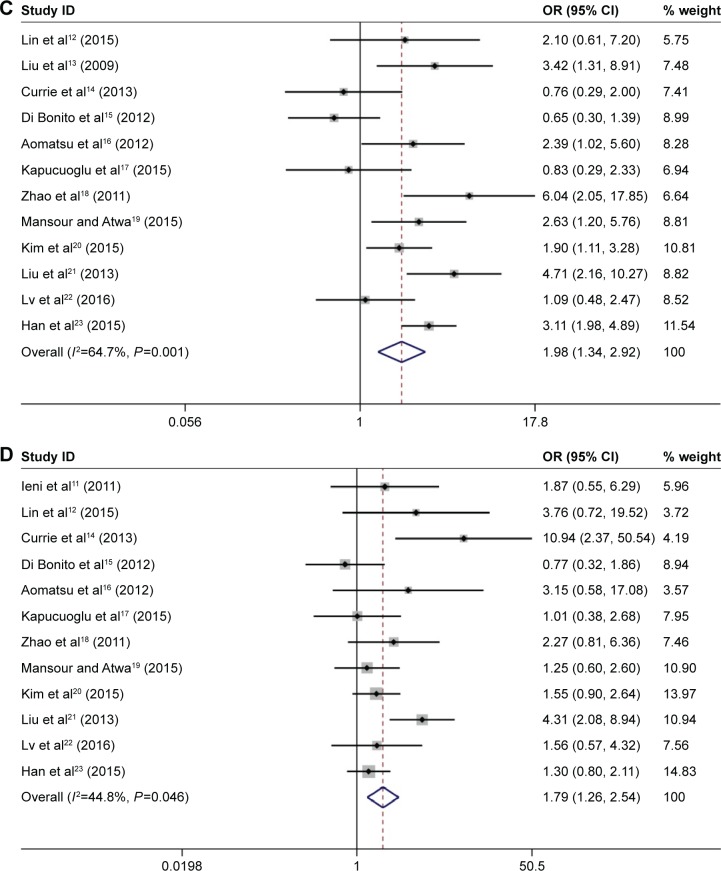
Figure 3.
Forest plots of ORs for the correlation between CD133 overexpression and age, tumor size, lymph node metastasis, and tumor histological grade.
Notes: (A) OR for the relation between CD133 overexpression and age; (B) OR for the relation between CD133 overexpression and tumor size; (C) OR for the relation between CD133 overexpression and lymph node metastasis; and (D) OR for the relation between CD133 overexpression and tumor histological grade. Weights are from random-effects analysis.
Abbreviations: OR, odds ratio; CI, confidence interval.


