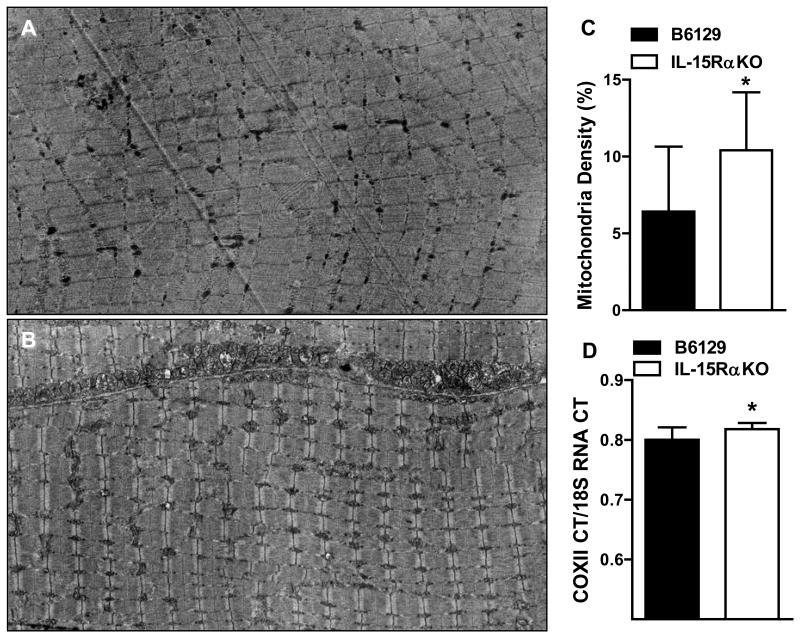
Figure 1. Mitochondrial density and mitochondrial DNA content in EDL muscles from IL-15RαKO mice.
(A) Representative electron micrograph of an EDL muscle from a B6129 control mouse. (B) Representative electron micrograph of an EDL muscle from an IL-15RαKO mouse. (C) Mitochondrial density was quantified through a point counting system, and was 48% greater in EDL muscles from IL-15RαKO mice compared to B6129 control mice. (D) Mitochondrial DNA content was significantly greater in EDL muscles from IL-15RαKO mice compared to B6129 control mice. *, p<0.05. Images were taken at 2000X.

