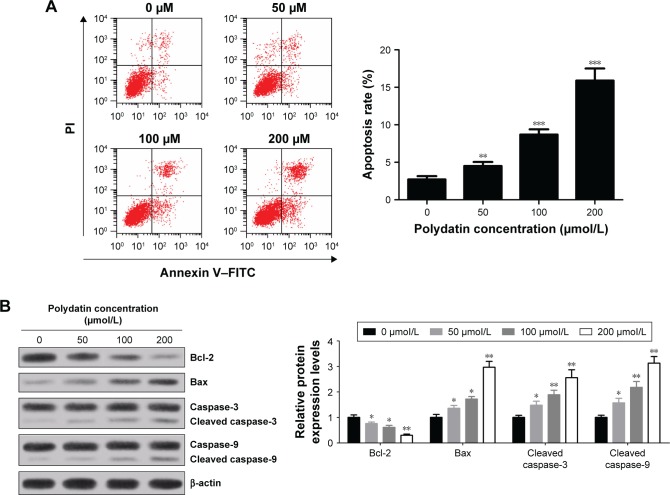
Figure 2.
PD induced apoptosis of RPMI 8226 cells. (A) Apoptosis rates with different concentrations (0, 50, 100 and 200 μmol/L) of PD treatment were assessed by flow cytometry followed by Annexin V–FITC/PI staining. (B) The levels of apoptosis-associated proteins cleaved caspase-3, cleaved caspase-9, Bcl-2 and Bax in RPMI 8226 cells treated with various concentrations (0, 50, 100 and 200 μmol/L) of PD were detected by Western blot and normalized to β-actin. Each group was analyzed by three independent experiments. Data are presented as mean ± SD. *P<0.05, **P<0.01, ***P<0.001 compared to 0 μmol/L.
Abbreviations: SD, standard deviation; PD, polydatin; FITC, fluorescein isothiocyanate; PI, propidium iodide.

