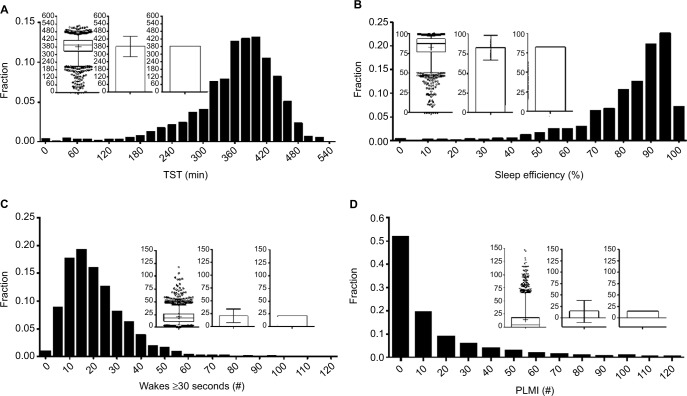
Figure 6.
Distributions of common PSG metrics.
Notes: Each panel contains a frequency histogram of n=1835 PSGs for TST (A), efficiency (B), number of wake transitions (C), and PLMI (D). In each panel, the inlay graph contains three plots of the same distribution: box and whisker, bar with SD, and bar plot with SEM. The clearly skewed distributions are largely hidden by the bar plots, compared to the histogram and box and whisker views.
Abbreviations: PLMI, periodic limb movement index; PSG, polysomnography; SEM, standard error of the mean; SD, standard deviation; TST, total sleep time.

