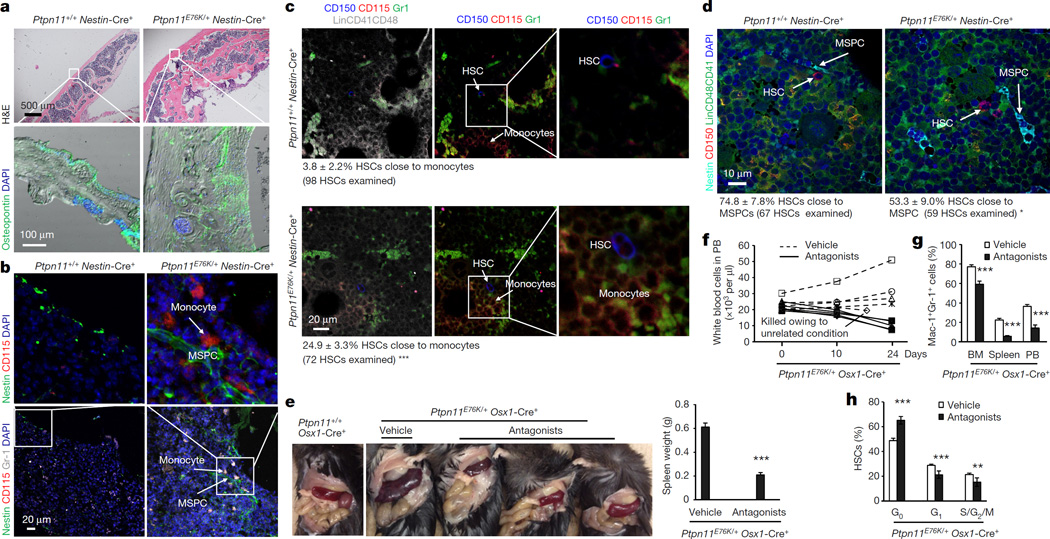
Figure 4. Ptpn11E76K/+ MSPCs recruit monocytes to the vicinity by excessive production of CCL3, leading to the hyperactivation and displacement of neighbouring HSCs from the niche.
7–10-month-old Ptpn11E76K/+Nestin-Cre+ mice and Ptpn11+/+Nestin-Cre+ littermates were analysed. a, Calvariums were processed for histopathological examination (haematoxylin and eosin (H&E) staining) and immunofluorescence staining with the indicated antibody. Slides were counterstained with the DNA dye DAPI (4',6-diamidino-2-phenylindole; n = 3 mice per group). b–d, Bone sections (one section per femur or tibia) were immunostained with the indicated antibodies (n = 5 mice per group). The spatial relationship between monocytes (CD115+Gr-1+) and MSPCs (Nestin+) (b), and between HSCs (Lin−CD48−CD41−CD150+) and monocytes (c) or MSPCs (d), were examined. HSCs within <8 µm of monocytes or MSPCs were considered as close to these cells. e–h, Six–seven-month-old Ptpn11E76K/+Osx1-Cre+ mice were treated with the CCR1 antagonist BX471 and the CCR5 antagonist Maraviroc or vehicle control for 23 days. Mice were killed, and spleens were weighted (n = 5 and 10 mice for the antagonist and vehicle groups, respectively) (e). White blood cell counts in the peripheral blood were determined at the indicated time points (n = 5 mice per group, each line represents one mouse) (f). Myeloid cells (Mac-1+Gr-1+) in the BM, spleen, and peripheral blood (PB) (n = 5 and 10 mice for the antagonist and vehicle groups, respectively) (g), and the cell cycle distribution of HSCs in the BM (n = 5 and 6 mice for the antagonist and vehicle groups, respectively) (h) were determined at the end of the experiments. Representative images are shown in a–d. Data shown in e, g, and h are mean ± s.d. of all mice examined; **P < 0.01; ***P < 0.001. Source Data for this figure are available online.

